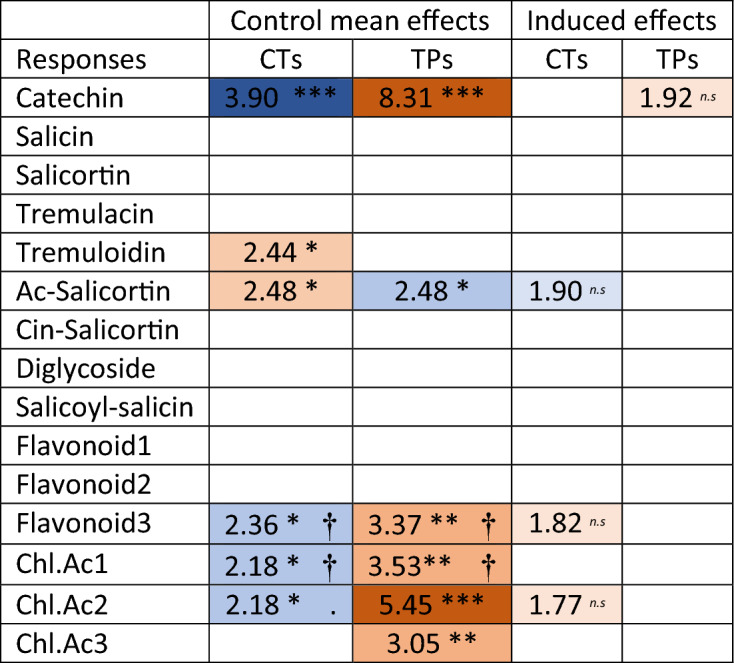
Table 3.
The importance of constitutive and induced CT and TP levels for induction of selected phenylpropanoids.

Treatment induced specific phenolic metabolites (17 phenolics obtained with use of LC/MS) were more often explained by genotype control means than by induced values of CTs and TPs. The two-factor general linear model, also included the effect of treatment (aphid and rupture), and full model summaries are listed in the Supplementary Materials File S6. LC/MS values were measured only in experiment 2 and the models were fitted to responses from plants under treatment, only. t-values for significant effects (df = 28, Significance levels:***P < 0.001;**P < 0.01;*P < 0.05; P < 0.1 = n.s.; P < 1 = no mark) are listed in the table, and colour codes indicate negative (blue) and positive (red) with intensity that correspond to significance value. †Refers to situations where the model suggested treatment effects P < 0.1. Flavonoids 1, 2 and 3 (aromadendrin, Hesperetin 7-O-glucoside and aromadendrin-7-O-glucoside); Chl.Ac 1, 2 and 3 (5-O-(4-coumaroyl)-D-quinate, 5-O-caffeoyl-D-quinate, O-feruloylquinate).
