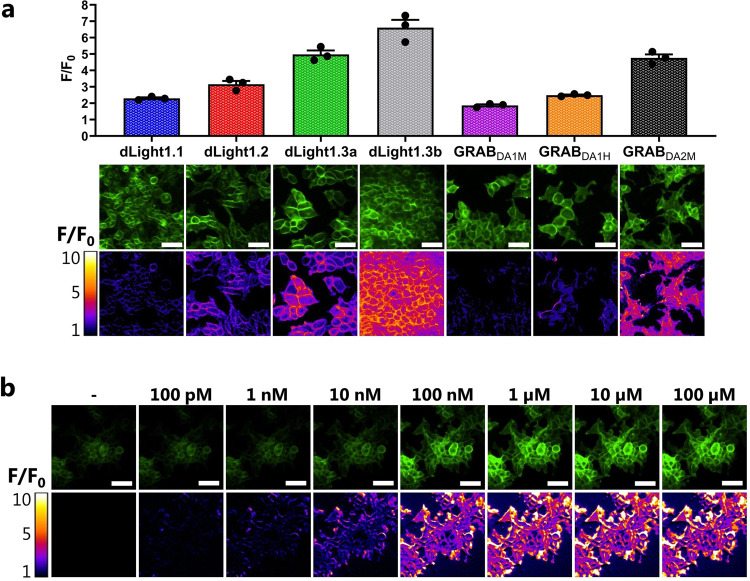
Fig. 1. Characterization of the dynamic range of DA sniffer cell lines.
a Visualization and quantification of the fluorescent change in Flp-In T-REx-293 cells expressing one of seven different DA sensors. Cells were stimulated with 10 µM DA while imaged on an epifluorescent microscope (N = 3, mean ± SEM). Representative images of the raw fluorescent signal are shown along with corresponding pseudo-colored representations of the fold change above baseline. Scale bars are 50 µM. b Representative images of GRABDA2M sniffer cells stimulated with increasing doses of DA show a dose-dependent increase in fluorescent (N = 3). Similar dose-response images of the remaining sniffer cell lines can be found in Supplementary Figs. 1, 2. Scale bars are 50 µM.

