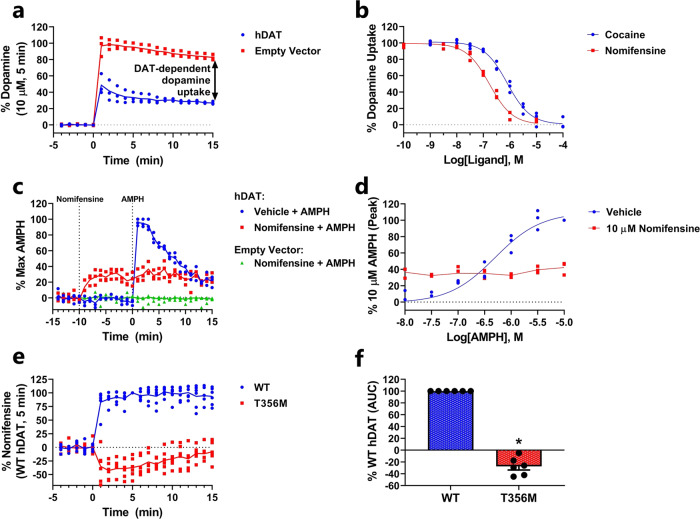
Fig. 3. Detection of DAT-mediated DA uptake and efflux using sniffer cells.
a Measurement of DA uptake using DA sniffer cells. GRABDA2M sniffer cells, transfected with hDAT, or an empty pcDNA3.1 expression vector, were stimulated with 1 µM DA for 15 min. The decreased fluorescent upon addition of DA to cells transfected with hDAT versus an empty vector is indicative of DAT-mediated DA uptake into the cells. To ensure that the measurements between hDAT and empty vector-transfected cells were comparable (as the expression of hDAT could affect the sensor expression) the data were normalized to a 5 min stimulation with a saturating concentration of DA (10 µM). The change in fluorescent upon DA addition is shown with a higher temporal resolution in Supplementary Fig. 4. b Preincubation of hDAT-transfected GRABDA2M sniffer cells with cocaine or nomifensine dose-dependently decreased the hDAT-mediated DA uptake. c, d Measurement of AMPH-induced DA efflux via DAT using DA sniffer cells. GRABDA2M sniffer cells transfected with hDAT or an empty pcDNA3.1 expression vector were loaded with 300 nM DA and washed subsequently. After reaching equilibrium, the baseline was recorded and the sniffer cells were incubated with 10 µM nomifensine or vehicle for 10 min followed by a 15 min stimulation with AMPH (c, 10 µM). AMPH caused a dose-dependent increase in fluorescent in hDAT-transfected cells, which was absent when the cells were preincubated with 10 µM nomifensine (d). e, f Recordings of anomalous DA efflux by the disease-associated DAT-T356M mutant. GRABDA2M sniffer cells were transfected with WT hDAT or hDAT-T356M. After loading the cells with 10 µM DA and subsequently washing away extracellular DA, the cells were stimulated with 10 µM nomifensine which blocks the constitutive anomalous DA efflux via hDAT-T356M. f Shows mean ± SEM area under the curve (AUC) for DAT-T356M relative to WT (N = 6, *P < 0.05 (<0.0001), one-sample t-test). The data were expressed as normalized Δ(F/F0). Curves are presented as connecting lines of the mean (a, c, e, d (nomifensine)) or fitted curves (b, d (vehicle)) in scatter plots from three independent experiments conducted on a fluorescent plate reader.

