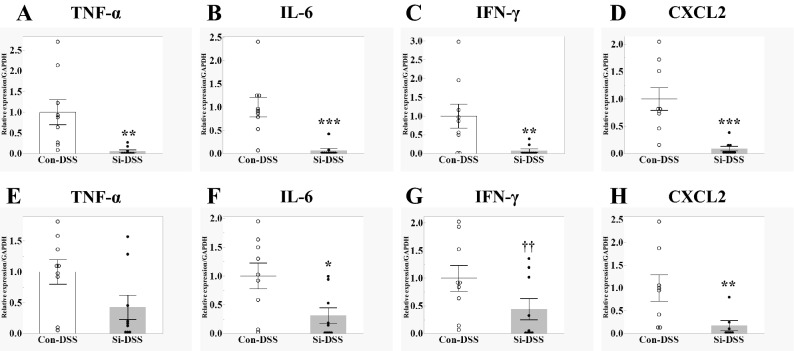
Figure 3.
Si-based agent suppressed the increase in pro-inflammatory cytokine and chemokine. mRNA expression of proinflammatory cytokines in the mouse large intestine 3 days after 5% DSS treatment, measured using quantitative reverse transcription-PCR analysis. Bar chart indicates the mean values (rectum: A–D; colon: E–H). TNF-α (A,E), IL-6 (B,F), IFN-γ (C,G) and CXCL2 (D,H). White: Con-DSS group. Black: Si-DSS group. Data are expressed as mean ± SEM of nine mice per group. ††p < 0.08, *p < 0.05, **p < 0.01, ***p < 0.001 vs. Con-DSS group, determined by Wilcoxon rank sum test.

