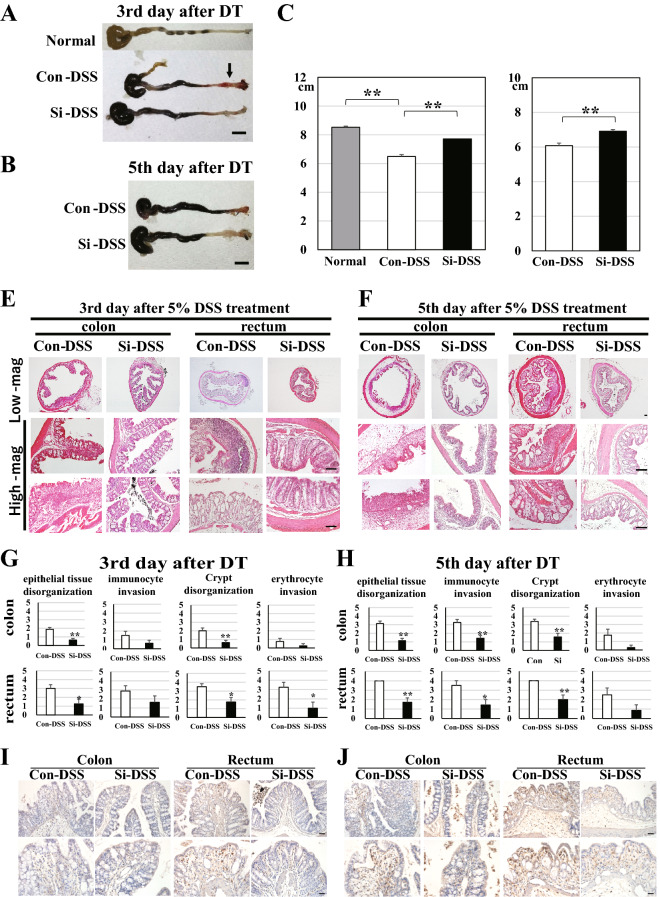
Figure 4.
Si-based agent suppressed the atrophy and structural disorder associated with intestinal inflammation. Measurement and pathological analysis of the large intestine of 5% DSS-treated mice. (A–D) The representative photograph (A,B) and the bar chart indicate the average of the actual values (C,D) 3 days (A,C) and 5 days after DSS treatment (B,D). (E,F) The representative HE-staining photographs obtained 3 days (E) and 5 days after 5% DSS treatment (F). Low-mag: low magnification and High-mag: high magnification. (G,H) The average bar chart of each histological score 3 days (G) and 5 days after DSS treatment (H). DT: DSS treatment. Colitis: DSS treatment. Gray: normal mice (4 mice), white: Con-DSS group (8 mice), and black: Si-DSS group (3 days: 8 mice, 5 days: 7 mice). Scale bar: 1 cm (A,B), 100 µm (C,D). (I,J) The representative F4/80-immunostaining photographs obtained 3 days (I) and 5 days after 5% DSS treatment (J). Upper panels: low magnification and bottom panels: high magnification. Scale bar: 100 µm (I), 50 µm (J). Data are expressed as mean ± SEM. *p < 0.05, **p < 0.01 vs. normal mice or Con-DSS, determined by Student’s paired t-test.

