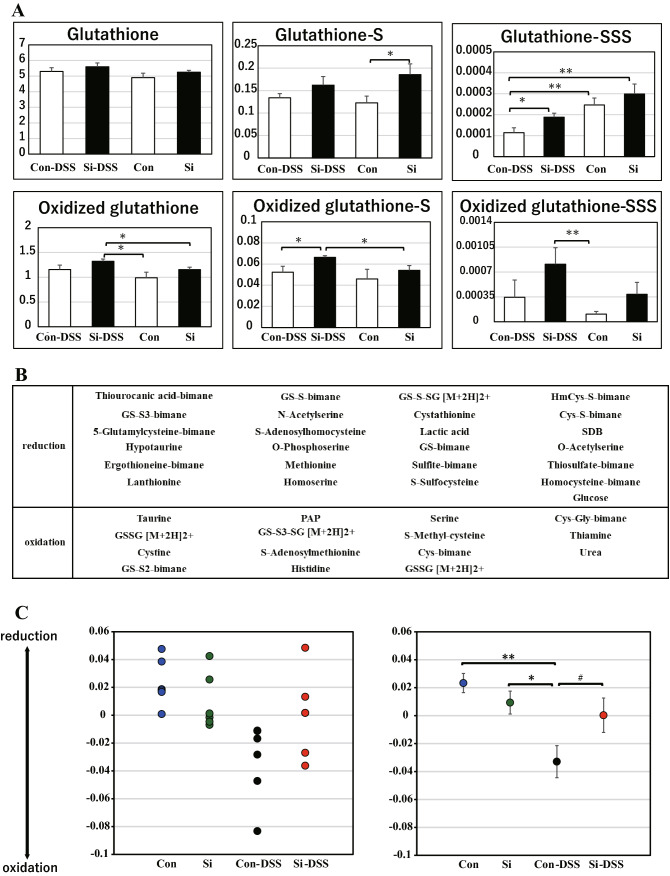
Figure 7.
Si-based agent suppressed the intestinal oxidation associated UC via antioxidant sulfur compounds. Sulfur index analysis of the mouse large intestine. The average bar graphs for the expression of glutathione, oxidized glutathione, and each persulfide (A). White: control or con-DSS group; black: Si or Si-DSS group. (B) Contributory compounds in sulfur-index analysis. (C) The dot graph of individual values and the average for sulfur index analysis. Data are expressed as mean ± SEM of six mice per group. ♯p < 0.08, *p < 0.05, **p < 0.01, determined by Student’s paired t-test.

