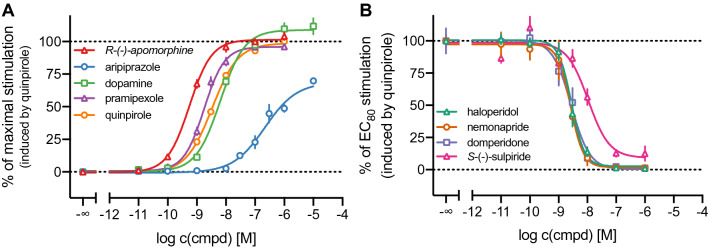
Figure 4.
Characterisation of a set of reference DR agonists (A) and antagonists (B) in the DMR assay. CHO-K1 hD2longR cells were treated with varying concentrations of the indicated ligands and the DMR signal was recorded over a time-course of 60 min. The maximum wavelength shift (Δλmax) was used to construct concentration-effect curves. In agonist mode (A), the response was normalised to a solvent control (0%) and the maximum response induced by 1 μM quinpirole (100%). In antagonist mode (B), the cells were preincubated with various concentrations of antagonist for 30 min before quinpirole was added at a concentration (30 nM) that induces the response equal to 80% of the maximal response induced by 1 μM of quinpirole. The response was normalised to a solvent control (0%) and the response induced by 30 nM quinpirole (100%). Data represent means ± SEM of three independent experiments, performed in triplicate.

