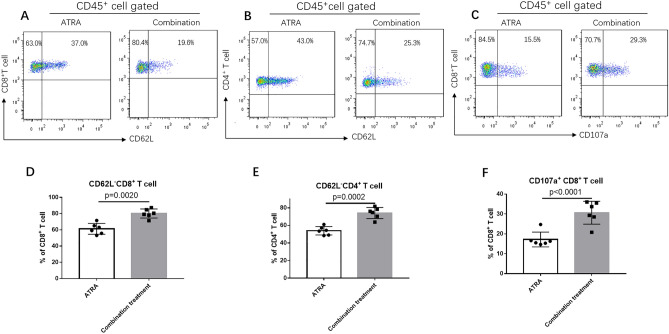
Figure 7.
The proportion of T cells with effector functions increased in vivo after combination treatment of ATRA and anti-PD-L1 mAb. Representative flow cytometry dot plots show CD62L−CD8+ T cells (A), CD62L- CD4+ T cells (B) and CD107a+ CD8+ T cells (C) in ATRA group and combination treatment group. The comparison of CD62L−CD8+ T cells (D), CD62L−CD4+ T cells (E), and CD107a+CD8+ T cells (F) proportions in two groups are shown. Data are shown as mean ± SD (6 mice/group, 2 repetitions with similar results).

