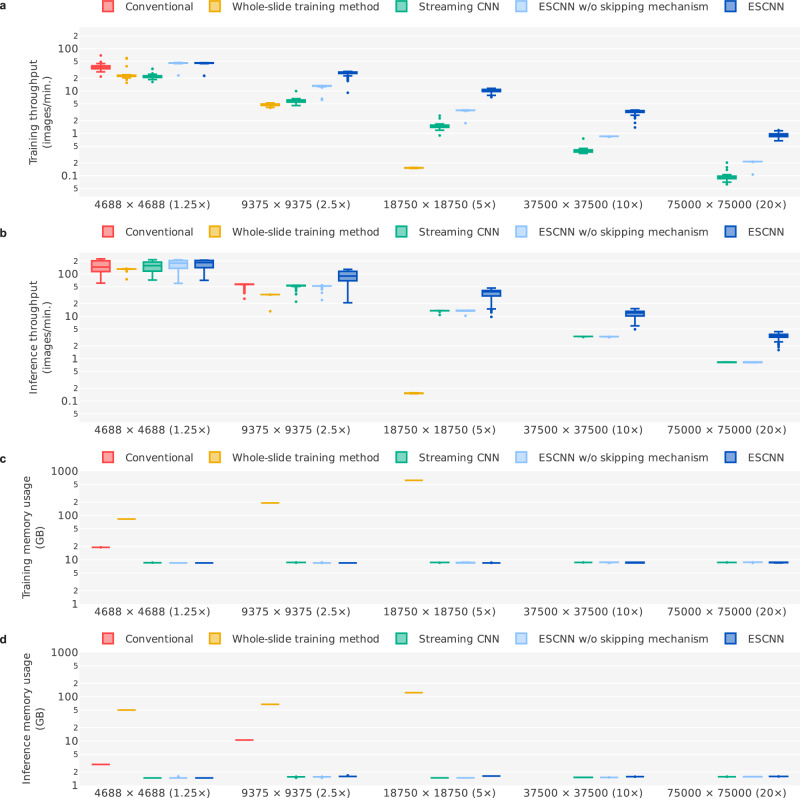
Fig. 3. Throughput and memory consumption of end-to-end training methods under various magnification levels of LN images.
Each panel represents the (a) training throughput, (b) inference throughput, (c) training memory consumption (referring to Unified Memory for the whole-slide training method and GPU memory for the others), and (d) inference memory consumption. For each setting, we recorded the training/inference time and memory consumption when processing each LN image (n = 100 images in total, sampled from the main training set). Each box-and-whisker plot comprises the center (median), the bounds of boxes (Q1 and Q3), the bounds of whiskers (the minimum and maximum within the range, obtained by adding the median to ±1.5 times the Q3–Q1 distance), and the outliers of the underlying 100 samples. The absence of certain boxes indicates that those settings could not be run due to memory shortages.

