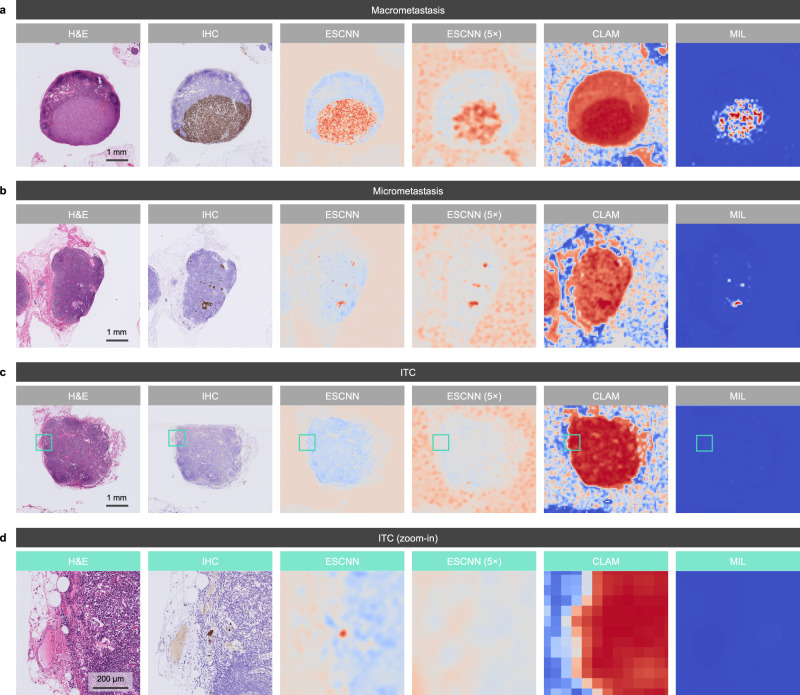
Fig. 4. Qualitative results of lesion highlights on macrometastasis, micrometastasis, and ITC cases.
Each panel displays an example of an H&E-stained LN image, the reference standard of the metastatic area under IHC staining (cytokeratin AE1/AE3), the heat map for lesion localization generated by our model through CAM, the heat map generated by a 5× low-resolution ESCNN model, the attention map of a CLAM model, and the prediction map of a MIL model. Identified metastatic tumor cells are highlighted in brown and red in the IHC stains and heat maps, respectively. Examples of (a) macrometastasis, (b) micrometastasis, and (c, d) ITCs identified from the main test set demonstrated the high correspondence of the model-predicted area with the IHC-predicted area, where (d) displays the high-power field of the green boxes in (c). Aside from the displayed examples, the localization performance of our model remained at the same level for the 263 LN images from the main test set that were correctly classified as metastases.

