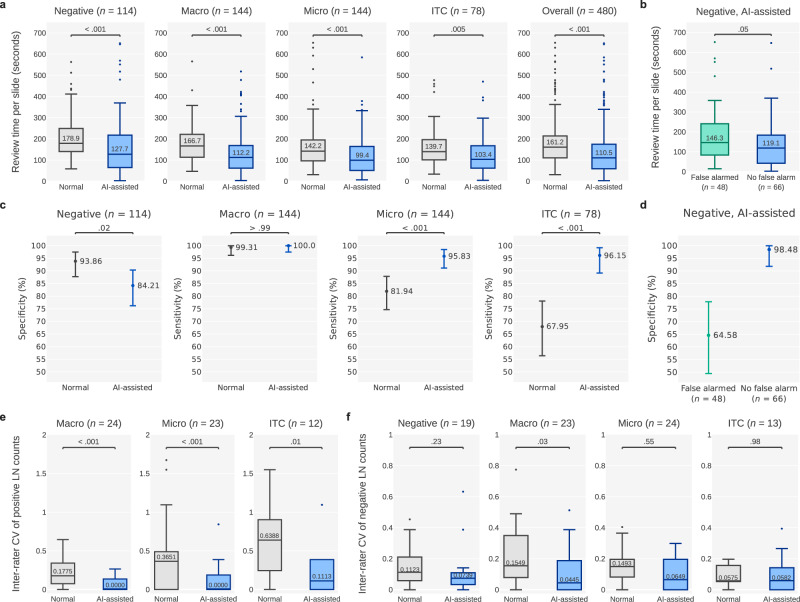
Fig. 6. Plots showing the review time, accuracy, and LN count consistency in the clinical experiments.
a Per-slide review time with and without AI assistance. Macro and Micro are the abbreviations of macrometastasis and micrometastasis respectively. b Impact of AI-attributable false alarms on review time, assessed by comparing the time taken to review negative slides for which false alarms were issued with the time taken to review negative slides for which false alarms were not issued. c Accuracies (i.e., specificities for negative slides and sensitivities for positive slides) achieved with and without AI assistance. d Impact of AI-attributable false alarms on specificities. e CVs per slide, calculated using the positive LN classifications of the six pathologists to quantify the interrater reliability of positive LN counts. f CVs per slide of negative LN classifications. The box-and-whisker plots in (a), (b), (e, f) comprises the center (median), the bounds of boxes (Q1 and Q3), the bounds of whiskers (the minimum and maximum within the range, obtained by adding the median to ±1.5 times the Q3–Q1 distance), and the outliers. The numbers within the boxes are the medians. The centers and error bars in (c, d) represent the sensitivities (or specificities) and the 95% confidence intervals, respectively.

