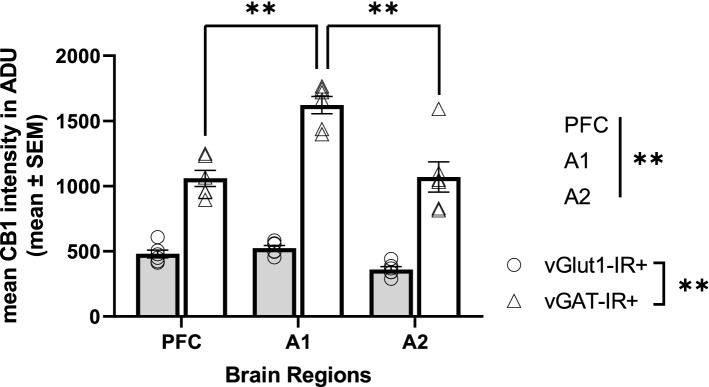
Figure 3.
Mean CB1R intensity within excitatory (vGlut1-IR +) and inhibitory (vGAT-IR +) cell types across three brain regions of the monkey cortex. Each individual data point represents mean intensity averaged across all sampled sites across a cortical layer. There was a main effect of cell type, p < 0.001, main effect of brain region, p < 0.001, and a significant cell type × brain region interaction, p < 0.001. While there were no differences in mean CB1R intensity within excitatory populations across brain regions, post hoc analysis indicated mean CB1R intensity within inhibitory populations was highest in the primary auditory cortex, followed by the association auditory cortex, with lowest mean CB1R intensity within inhibitory populations in the PFC, p < 0.001. Straight lines indicate main effects across groups. Brackets indicate post hoc pairwise comparisons. **p < 0.001. Error bar denotes SEM. PFC = prefrontal cortex, A1 = primary auditory cortex, A2 = association auditory cortex.

