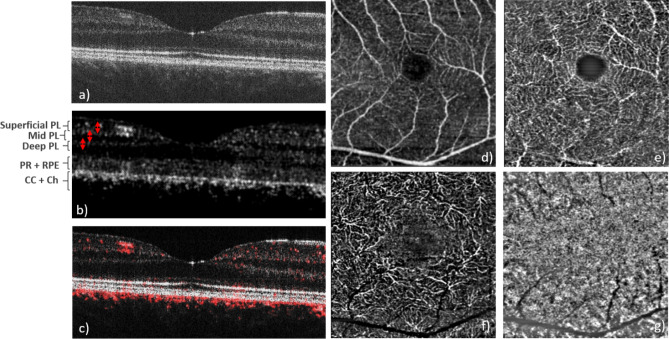
Figure 3.
Representative image data recorded with the 10° × 10° field of view scanning pattern and 4 B-scans at the same location. (a) Single B-scan intensity image, (b) OCTA B-scan, (c) composite image of intensity (grey) and OCTA (red), (d) superficial vascular plexus, (e) mid vascular plexus, (f) deep vascular plexus (the integration depth of the en-face projections are indicated with the red arrows in b,g) choriocapillaris (en-face projection over three pixels below the RPE). PL plexus, PR photoreceptors, RPE retinal pigment epithelium, CC choriocapillaris, Ch choroid.

