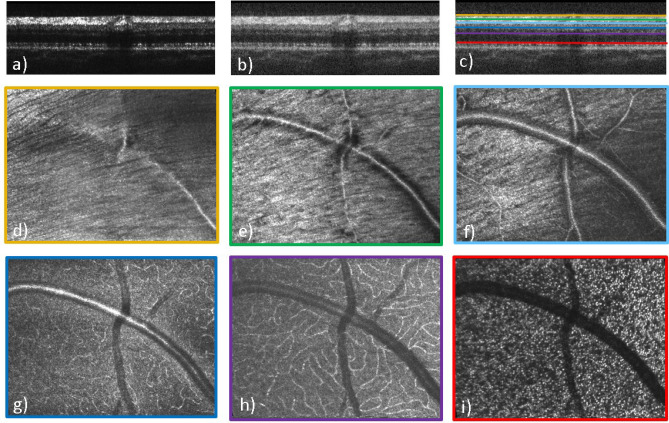
Figure 5.
AO-OCT B-scan (a–c) and en-face images of different layers (d–i) recorded with a field of view of 4° × 3°. (a) B-scan in linear scale, (b) B-scan in log scale, (c) color-coded lines indicating the location of the corresponding en-face layers in B-scan, (d) inner limiting membrane, (e) nerve fiber layer, (f) superficial vascular plexus layer, (g) mid vascular plexus layer, (h) deep vascular plexus layer, (i) inner/outer segment junction layer.

