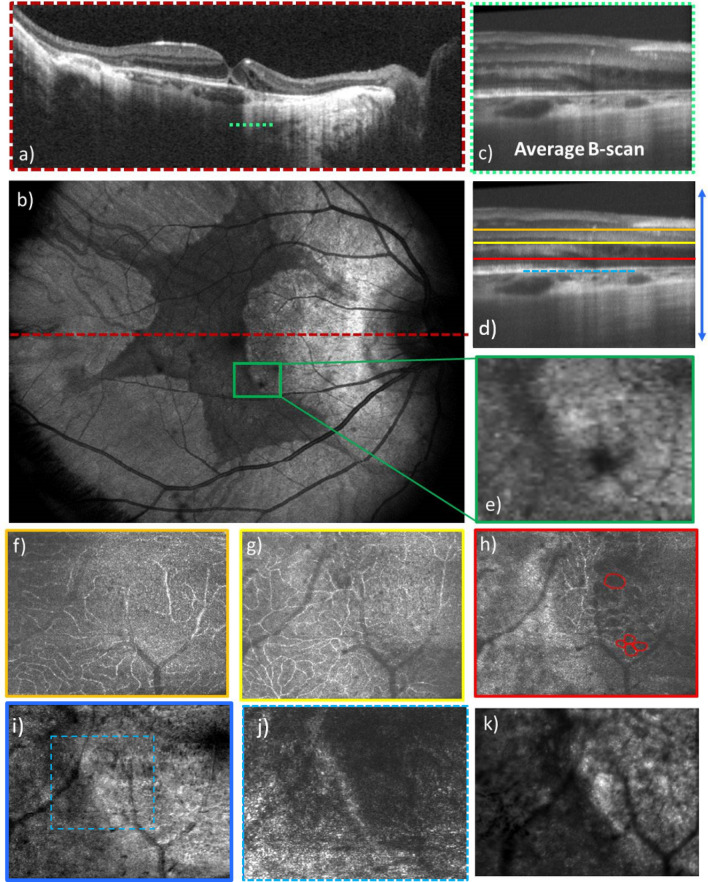
Figure 7.
AO-OCT and AO-SLO images of a patient with choroideremia disease with 4° × 3° field of view along with the large field of view images. (a) Average OCT large field of view B-scan in log scale, (b) OCT large field of view en-face projection image with 40° × 30° field of view, (c) average AO-OCT B-scan in log scale, (d) location of corresponding layers displayed in the en-face images, (e) large field of view en-face projection image with zoom at the location imaged with AO-OCT, (f) mid capillary plexus layer, (g) deep capillary plexus layer, (h) outer nuclear layer with red circles indicating the microcysts, (i) entire depth projection image, (j) depth projection over photoreceptor and RPE layers at the 2° × 2° field marked in (j,k) AO-SLO image of the corresponding location.

