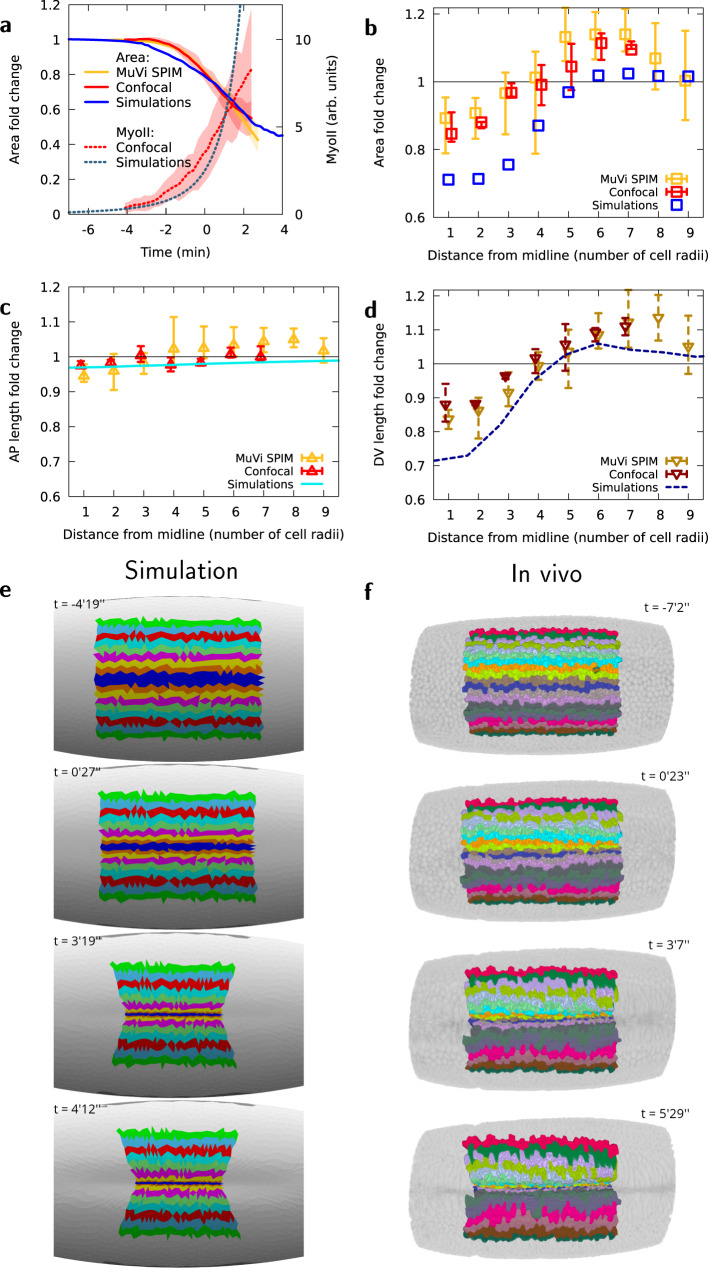
Fig. 3. In vivo apical area changes are reproduced by the computational model.
a MyoII average intensity and mesoderm apical area changes as a function of time, for in vivo analysis and simulations, averaged over all cells within five rows of the ventral midline. b Apical area fold-change relative to the initial area (t = −4 min) of cells at different lateral distances from the midline at t = −1 min, in observations for in vivo analysis and simulations. (c) Apical AP size fold-change relative to the initial size (t = −4 min) of cells at different lateral distances from the midline at t = −1 min, d Apical DV size fold-change relative to the initial size (t = − 4 min) of cells at different lateral distances from the midline at t = −1 min, for in vivo analysis and simulations. Panels (a–d), n = 3 embryos using multi-view light sheet and n = 3 embryos using confocal microscopy, shaded areas in (a) and error bars in (b–d), minimum and maximum values among the corresponding embryos. e, f Time evolution of AP stripes of apical surface in simulation and MuVi SPIM, respectively.

