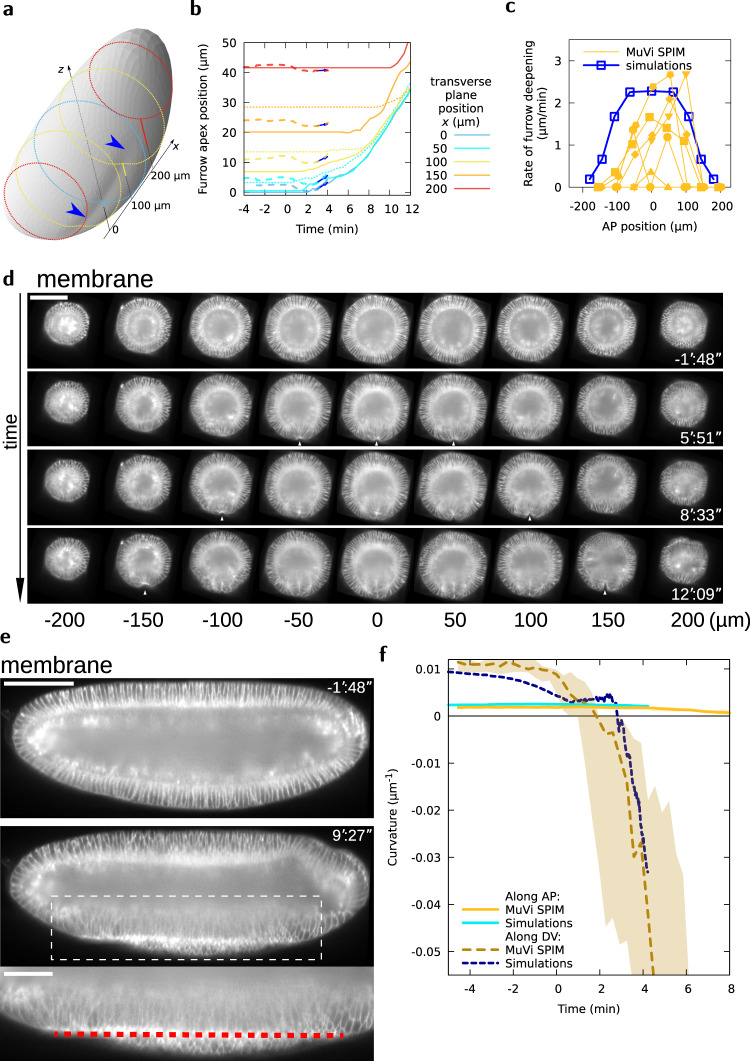
Fig. 4. VFF results from tissue curvature changes along the DV and AP axes.
a Embryo shape during VFF in simulations at . Shading reveals furrow shape, blue arrowheads. Dotted lines are transverse cuts, solid lines give the furrow apex offset from a reference z position at different x positions. b Furrow apex position at different AP positions as a function of time in MuVi SPIM experiments (solid lines, posterior side, dotted lines, anterior side, n = 6) and simulations (dashed lines and arrow showing slope at ). c Rate of furrow formation at different AP positions at . d Digital cross-sections at different AP positions. White arrowheads indicate VFF initiation. Scale bar 100 μm. e Digital mid-sagittal section of the embryo. Red line indicates ventral tissue flattening. Scale bars 100 μm, zoom 50 μm. f Curvature of the ventral tissue along the AP and DV axes as a function of time (MuVi SPIM, n = 6 embryos, shaded area denotes minimum and maximum).

