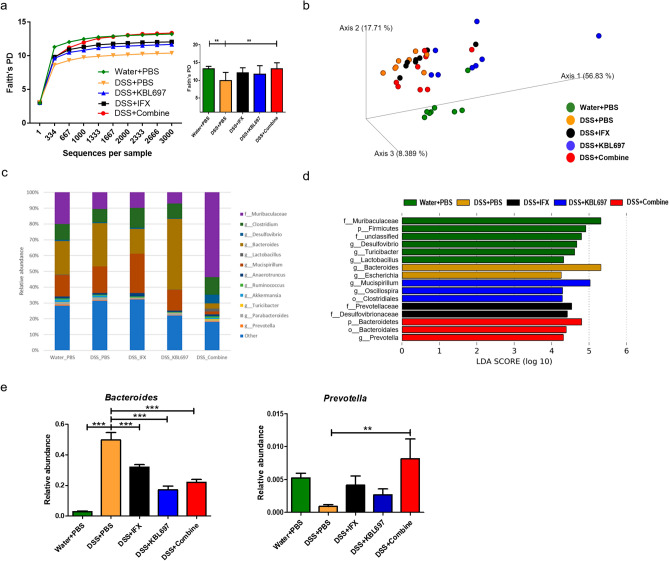
Figure 5.
Effect of the different treatments on cecal microbiota composition. (a) Rarefaction plots using Faith’s phylogenetic diversity (PD) whole tree indices. (b) Principal coordinates analysis with unweighted UniFrac distances. (c) Taxonomic structures of cecal microbiota. (d) LEfSe results in experimental groups (threshold > 2.5). (e) Relative abundances of significantly different microbial taxa in experimental groups at the genus level. When appropriate, statistical analysis was performed using one-way ANOVA with Dunnett’s post hoc test (*P < 0.05; **P < 0.01; ***P < 0.001).

