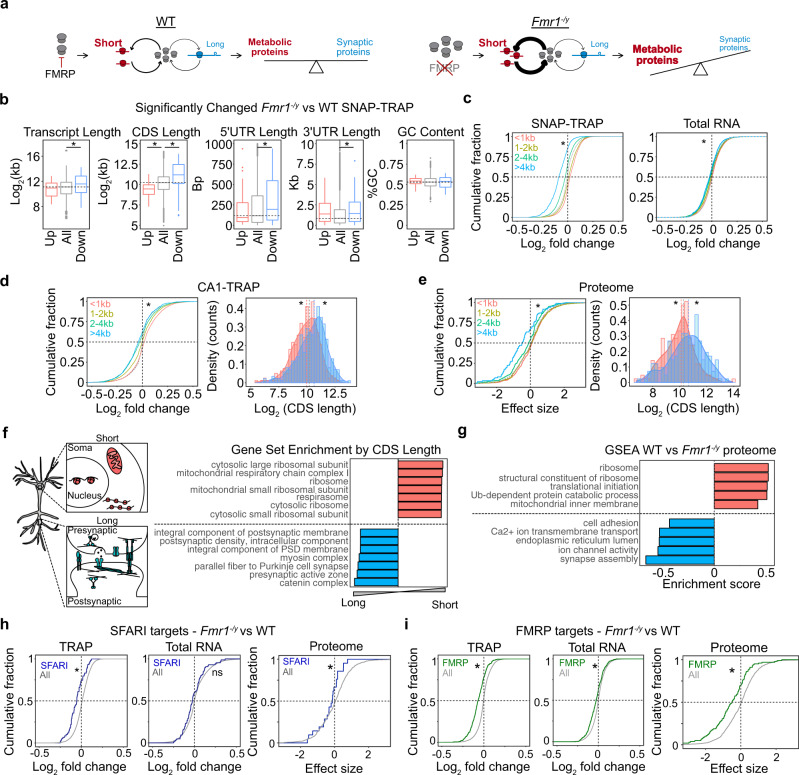
Fig. 4. Under-translation of long mRNAs causes reduced expression of synaptic proteins, autism risk factors, and FMRP targets in Fmr1−/y hippocampal neurons.
a A model of altered translation in FX proposes that increased ribosome production changes the differential rate of translation between short and long mRNAs, which ultimately alters the proportion of proteins with metabolic versus synaptic functions. b The significantly altered Fmr1−/y SNAP-TRAP population (DESeq2 adjusted P value < 0.1) exhibits an imbalance in transcript length, CDS length, 5’UTR length and 3’UTR that indicates under-translation of long, low-initiation mRNAs (transcript length: Kruskal–Wallis *P = 4.01 × 10⁻⁵, Wilcoxon rank-sum test all vs up P = 0.733, all vs down *P = 7.28 × 10⁻⁶, CDS length: Kruskal–Wallis *P = 2.219 × 10⁻¹⁴, Wilcoxon rank-sum test all vs up *P = 3.181 × 10⁻⁵, all vs down *P = 1.516 × 10⁻¹¹, 5’UTR length: Kruskal–Wallis *P = 0.01179, Wilcoxon rank-sum test all vs up P = 0.9794, all vs down *P = 0.00282, 3’UTR length: Kruskal–Wallis *P = 0.0022, Wilcoxon rank-sum test all vs up P = 0.1103, all vs down *P = 0.001827, coding GC content: Kruskal–Wallis P = 0.5817). c A binned analysis of the total Fmr1−/y SNAP-TRAP population shows that the CDS length imbalance is seen in the whole ribosome-bound population, with the shortest group showing the most positive log2 fold change distribution and the longest group showing the lowest log2 fold change (two-sided KS test, <1 kb vs >4 kb *P < 2.2 × 10⁻¹⁶ d = 0.537). The total transcriptome also demonstrates this property but at a much lower magnitude (KS test <1 kb vs >4 kb *P = 2.00 × 10⁻¹¹ d = 0.1470). d The Fmr1−/y CA1-TRAP population shows a similar CDS length bias that can be seen in a binned analysis or a comparison of the top 500 most up- and downregulated mRNAs ranked by log2 fold change (two-sided KS test <1 kb vs >4 kb *P < 2.2 × 10⁻¹⁶, two-sample z test all vs up z = −3.416, *P = 0.0006356, all vs down z = 5.0454, *P = 4.525 × 10⁻⁷). e The Fmr1−/y proteome exhibits a CDS length-dependent imbalance that mirrors the results seen by TRAP, both in a binned analysis (two-sided KS test <1 kb vs >4 kb *P = 2.84 × 10⁻⁶) and comparison between the 200 most up- and downregulated proteins (two-sample z test, up vs all: z = −2.8216 *P = 0.005, down vs all: z = 3.0408, *P = 0.0024). f A Gene set analysis ranked by CDS length reveals that shorter transcripts are enriched with the ribosome and mitochondrial genes whereas longer transcripts are enriched with synaptic structure-related genes. g GSEA of the Fmr1−/y proteome shows a significant downregulation of synaptic gene sets and a significant upregulation of ribosome/mitochondrial gene sets. h SFARI targets are downregulated in the Fmr1−/y SNAP-TRAP population (two-sample z test, z = −5.43 P = 5.65 × 10⁻⁸) and not changed in the total RNA population (two-sample z test, z = −1.64, P = 0.099). SFARI targets are significantly underexpressed in the Fmr1−/y proteome, consistent with the under-translation seen by TRAP (two-sample z test, z = −2.0008, *P = 0.045). i FMRP targets are significantly downregulated in the Fmr1−/y SNAP-TRAP population (two-sample z test, z = −12.461 *P < 2.2 × 10⁻¹⁶) and changed to a lesser degree in total RNA population (two-sample z test, z = −5.42, P = 5.805 × 10⁻⁸). FMRP targets are significantly reduced in the Fmr1−/y proteome (two-sample z test, z = 5.30, *P = 1.135 × 10⁻⁷).

