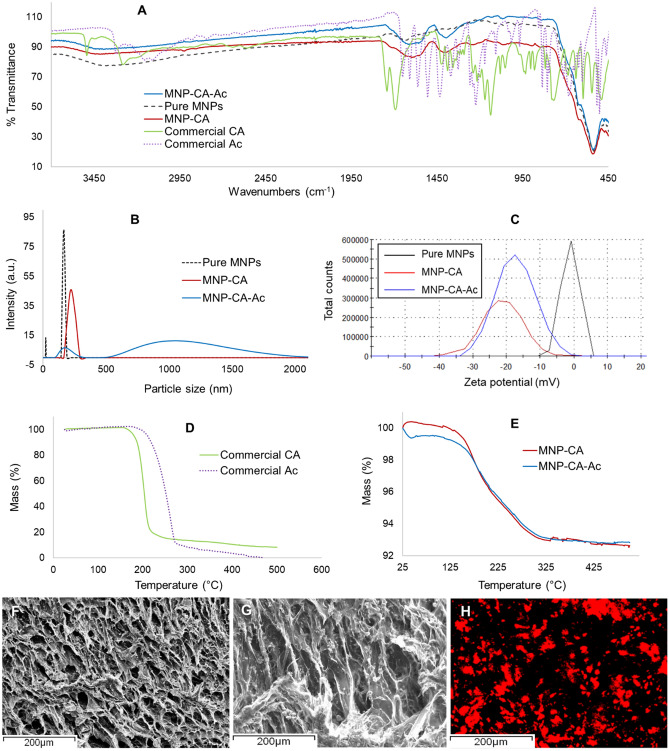
Figure 2.
Characterization of PVA-MNP hydrogels. (A) FTIR spectra of all samples. (B) DLS data for pure MNPs, MNP-CA and MNP-CA-Ac samples indicating differences in particles sizes. (C) Zeta potential data for pure MNPs, MNP-CA and MNP-CA-Ac samples indicating differences in surface charges. (D) TGA data for commercial citric and acetaminophen. (E) TGA data for MNP-CA and MNP-CA-Ac samples. (F, G) SEM images of freeze-dried drug coated PVA-MNP hydrogels. (H) EDX data for SEM image G, where drug coated MNP distribution is depicted in red, indicating a homogeneous distribution of the MNP-CA-Ac system within the hydrogel.

