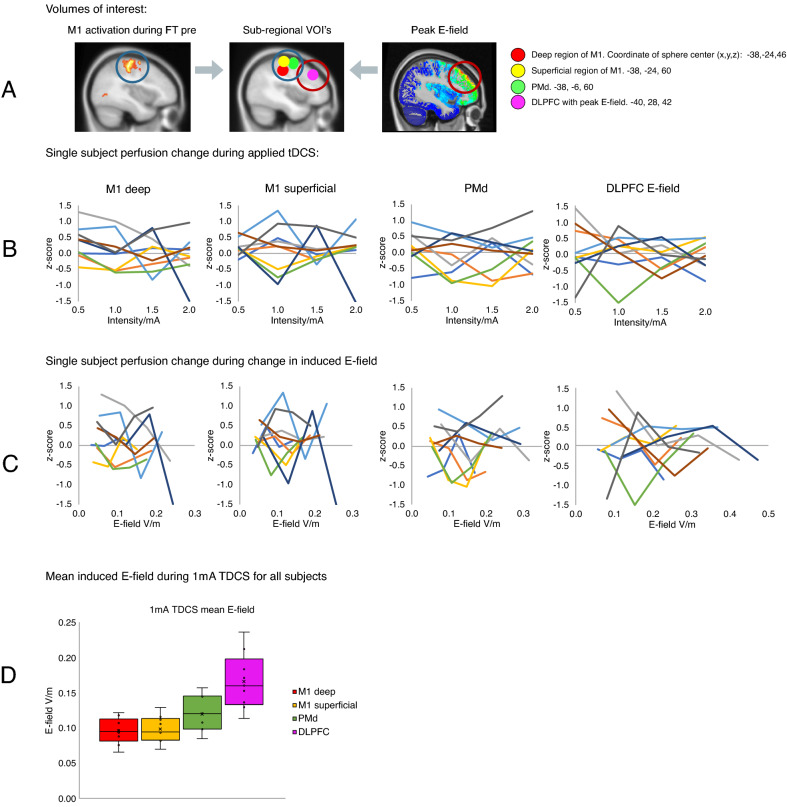
Figure 4.
Individual changes in regional cerebral blood flow within four spherical volumes of interest (VOIs) with a radius of 10 mm. (A) The regional peak activations during finger-tapping prior to stimulation (FT-pre) was used as a functional localizer for the three spheres. Spheres were placed in the superficial primary motor cortex (M1) (yellow, center coordinate: − 38; − 24; 60) the deep part of M1 (red, center coordinate: − 38; − 24; 46) and the left dorsal premotor cortex (green, center coordinates − 38; − 6; 60). The fourth VOI (magenta) was placed at the location of maximum induced E-field in all subjects (center coordinate − 40; 28; 42). (B) Plots show individual activation within each VOI for each stimulation intensity. (C) Plots show individual activation within each VOI as a function of the induced E-field instead of TDCS intensity. (D) Boxplot of mean induced E-field in all four VOI’s at 1 mA TDCS. Y-axis shows induced E-field V/m. Outliers defined being beyond 1.5 inter-quartile range of each quartile.

