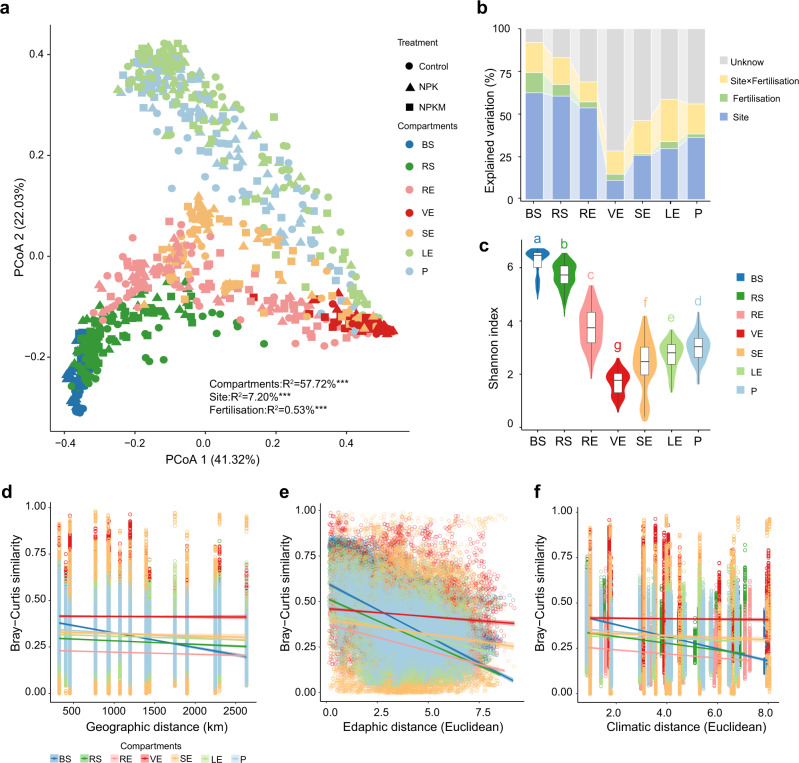
Fig. 1. Effects of soil type and fertilisation on the maize microbiome.
a Unconstrained principal coordinates analysis (PCoA) with weighted unifrac distance across the whole dataset. (***P < 0.001, PerMANOVA by Adonis). Control: no fertilisation; NPK: chemical fertiliser nitrogen, phosphorus, and potassium; NPKM: organic manure plus chemical fertiliser; BS: bulk soil; RS: rhizosphere soil; RE: root endosphere; VE: xylem sap; SE: stem endosphere; LE: leaf endosphere; P: phylloplane. b Effects of site, fertilisation treatments, and site × fertilisation on bacterial community structure in each compartment as tested by PerMANOVA. c Violin plot showing distribution of Shannon’s index of the bacterial community in each compartment. Horizontal bars within boxes denote medians. Tops and bottoms of boxes represent 25th and 75th percentiles, and lines extend to the 1.5× interquartile range. Letters indicate statistical significance among groups using two-sided Wilcoxon test (adjusted P < 0.05 by Benjamini and Hochberg method). The sample sizes are as follows: BS, 126; RS, 141; RE, 138; VE, 119; SE, 120; LE, 158; P, 152. d–f, Distance-decay curves showing Bray–Curtis similarity against geographic distances (d), edaphic distances (e), and climatic distances (f). Solid lines represent ordinary least-squares linear regressions. Source data and exact P values are provided in the Source Data file.

