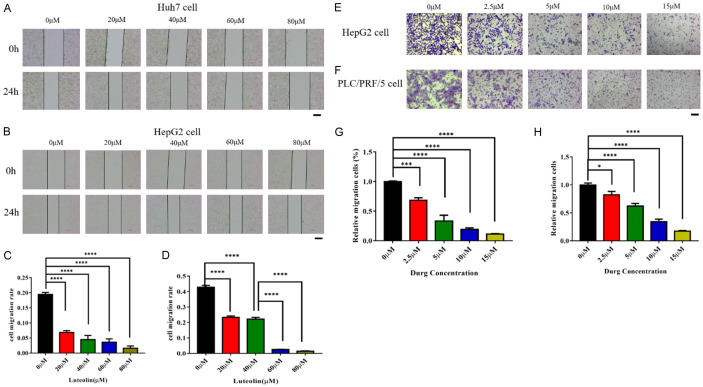
Figure 4.
Inhibitory effect of luteolin on migration of hepatoma cell. A, B. The representative images of wound healing test of Huh7 and HepG2 cells at specified luteolin concentration (0-80 μM). C, D. The relative migration distance of cells in three different visual fields. This experimental result was obtained through more than three independent experiments. The data represent the means ± SDs of triplicate experiments. ****, P < 0.0001. E, F. The transwell migration experiments and specific representative images of HepG2 cells and PLC/PRF/5 cell at specific luteolin concentrations. G, H. Quantitative measurement of numbers of migrated cells in three different visual fields are shown for 24 h. This experimental result was obtained through more than three independent experiments. Scale bar = 200 μm. The data represent the means ± SDs of triplicate experiments. *, P < 0.05; ***, P < 0.001; ****, P < 0.0001.

