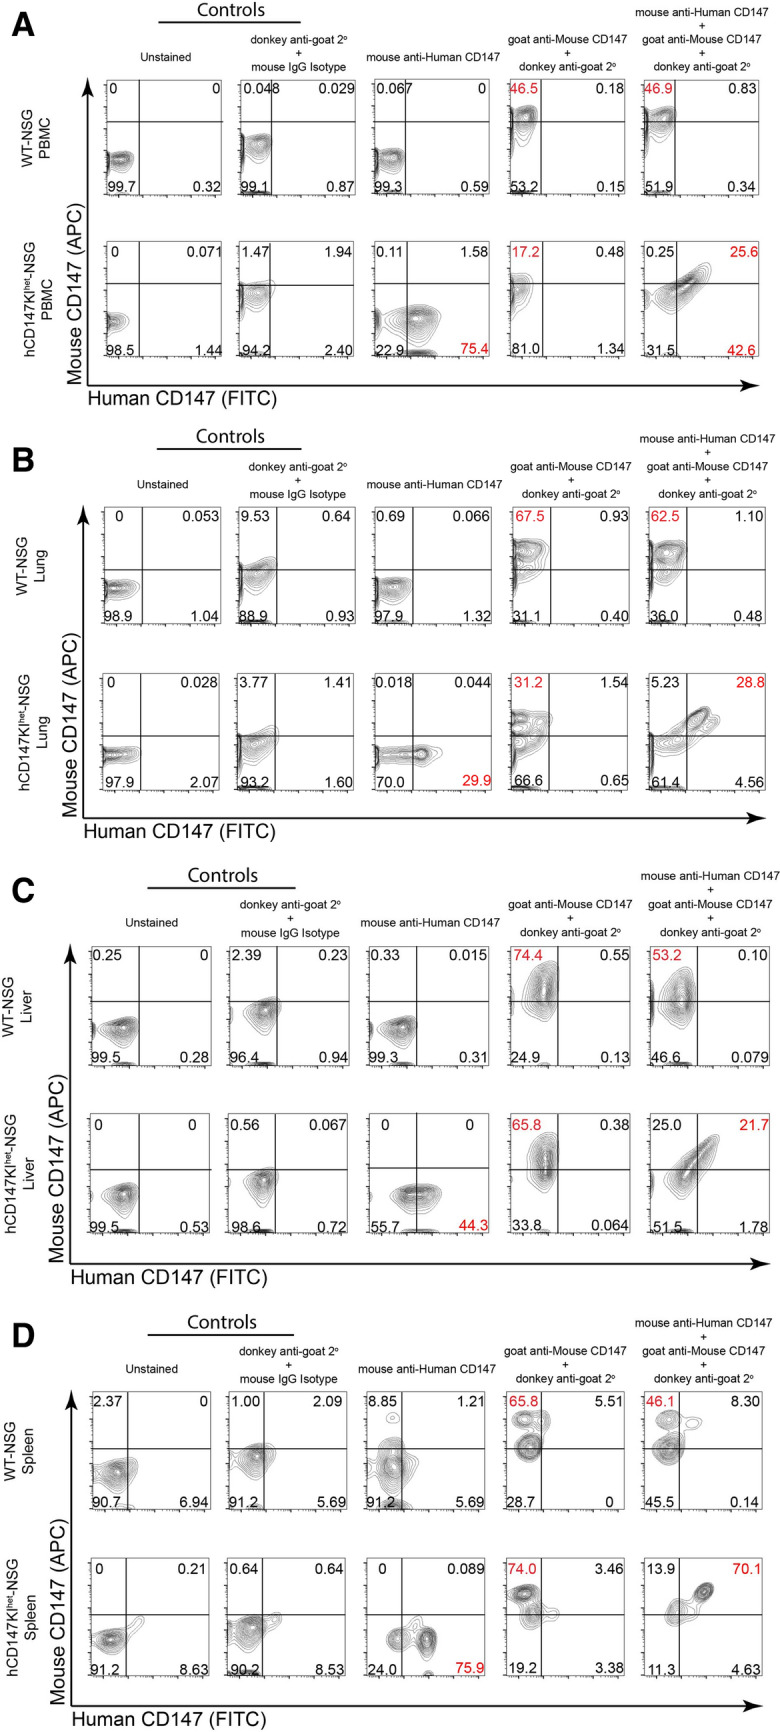
Fig. 3.

Flow cytometric analysis reveals proper dual-expression of both mCD147 and hCD147 in PBMCs and various organs. Representative contour plots of CD147 expression on WT-NSG (top) and hCD147KIhet-NSG (bottom) cells from (A) PBMCs, (B) lung, (C) liver, and (D) spleen using antibodies targeting either mouse CD147 protein, human CD147 protein, or a combination of both antibodies (far right). Relative percentages are listed, and significant shifts highlighted in red. Gating was determined based on donkey anti-goat/mouse isotype IgG antibody background staining
