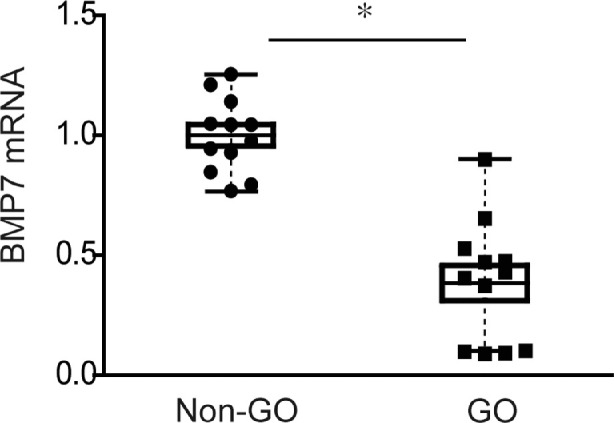
Figure 1.

Expression of BMP7 mRNA in GO tissues in comparison to non-GO normal control tissues. RNA was extracted form GO (n = 12) and non-GO (n = 12) orbital tissues. Using real-time PCR, BMP7 mRNA transcript levels were compared between GO and normal control tissues. A single dot represents an average value obtained from the experiments on a single donor (*P < 0.05 vs. non-GO tissues). The samples were assayed in triplicate. The results are expressed as the median and interquartile ranges by box plot.
