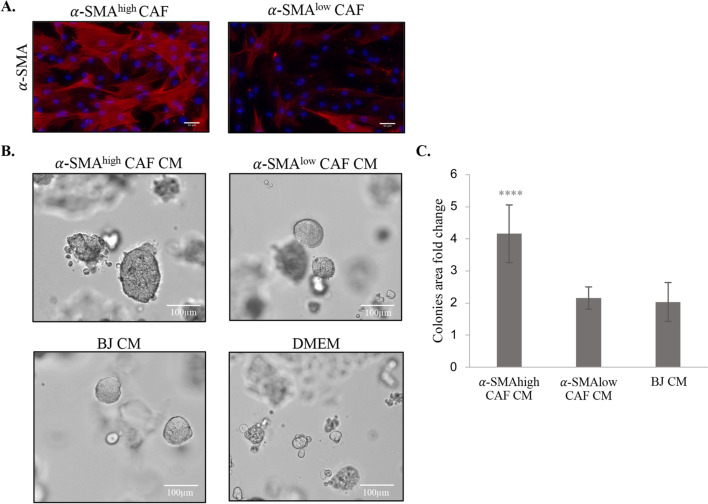
Fig. 2.
Characterization of CAFs isolated from patients with BC. A Representative pictures of immunofluorescence staining for α-SMA (red) in α-SMAlow and α-SMAhigh CAFs; DAPI (blue) was used for nuclei counterstaining. B Representative pictures of MCF7 cells growing in 3D-Matrigel cultures, when treated with conditioned medium from α-SMAlow or α-SMAhigh CAFs, and BJ or DMEM as a control. C Quantification of colony area fold change. Colony area was determined with ImageJ software. The values presented are mean ± SD from three independent experiments (n = 2 technical replicates). Unpaired Student’s t-test test was applied, ***p < 0.0001 calculated versus control (DMEM)

