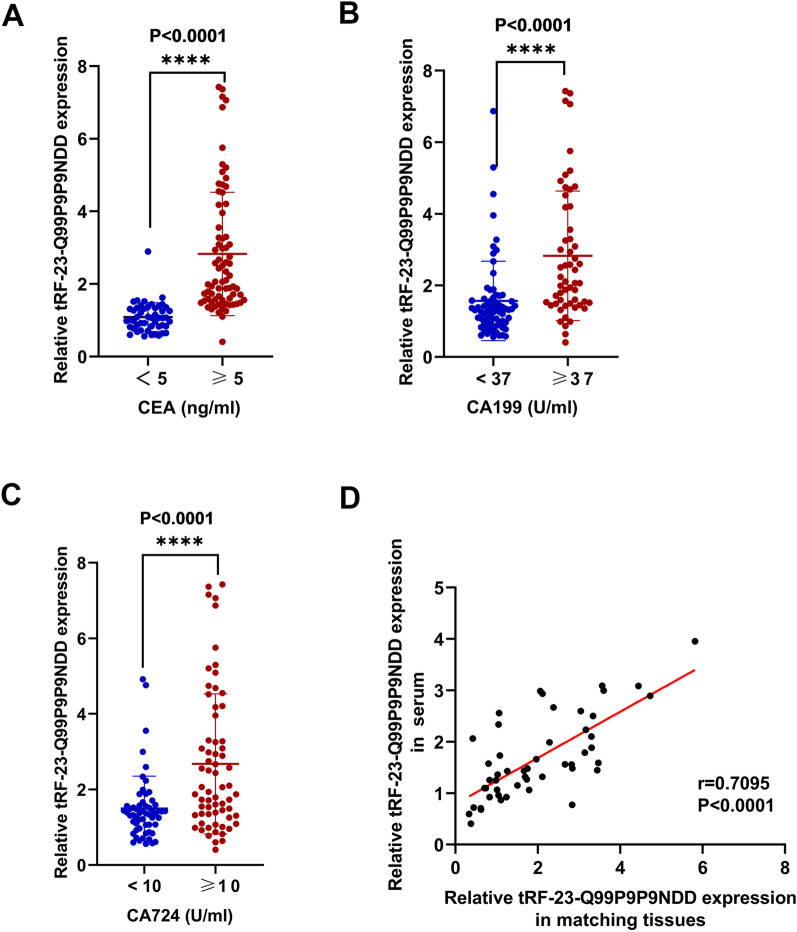
Fig. 4.
The relationship between the expression levels of serum tRF-23-Q99P9P9NDD and conventional biomarkers of GC. A–C GC patients were divided into two groups according to the diagnostic thresholds of CEA, CA199, and CA724, and the expression level of tRF-23-Q99P9P9NDD was analyzed respectively. D Pearson correlation analysis was performed on tRF-23-Q99P9P9NDD expression levels in 50 GC tissues and serum samples from corresponding patients. *P < 0.05; **P < 0.01; ***P < 0.001; ****P < 0.0001

