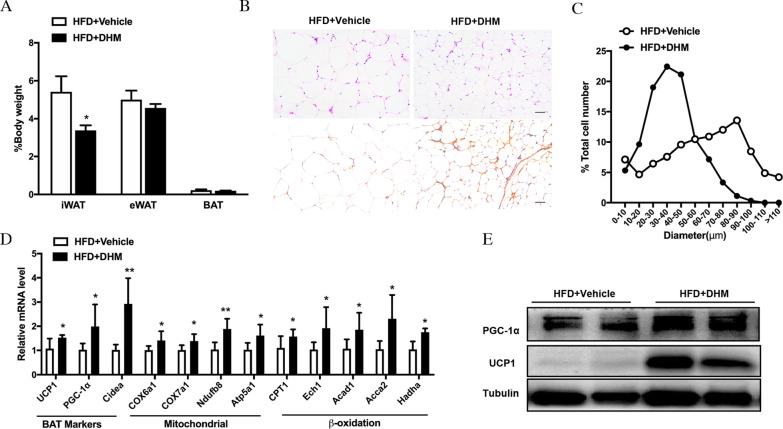
Fig. 3.
DHM stimulates iWAT browning. A iWAT mass, epididymal WAT (eWAT) mass and BAT mass normalized by body weight (n = 5). B Representative H&E staining of iWAT (upper panel) and UCP1 immunohistochemistry (brown) (lower panel), scale bar = 100 μm. C Percentage of different adipocyte cell sizes in iWAT(n = 5). D RNA expression profiles of the brown fat marker and mitochondrial-related and fatty acid oxidation-related genes in iWAT. E PGC-1α and UCP1 protein expression in iWAT. Data are presented as the mean ± SEM. *P < 0.05, **P < 0.01

