
Fig. 5.
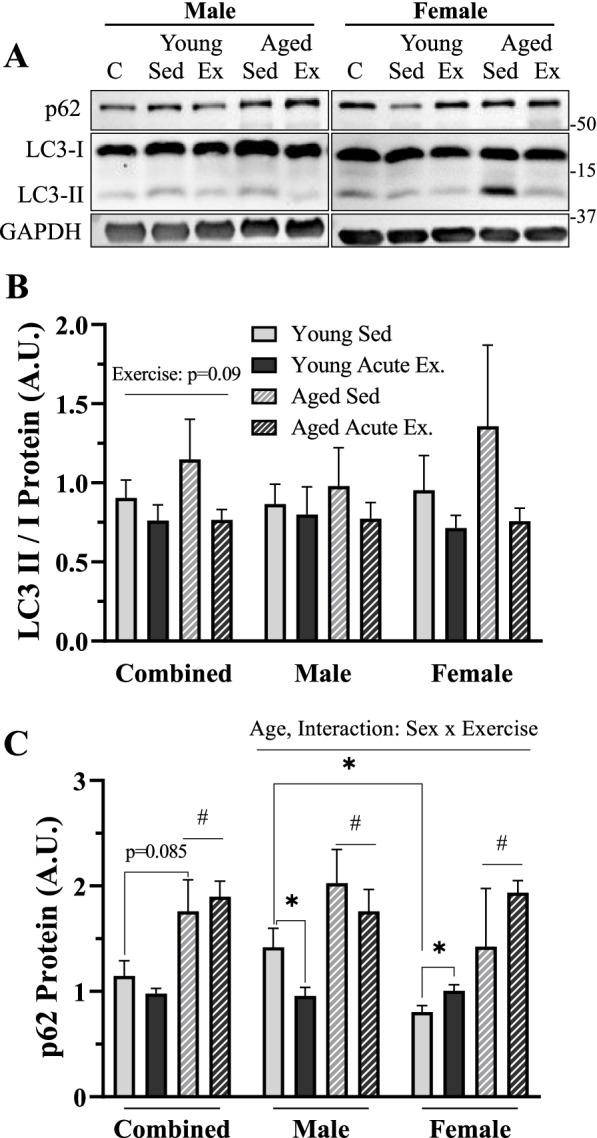
Autophagosomal proteins in sedentary and acute-exercised young and age, male and female mice. A Representative western blots for p62, LC3-I, and LC3-II. B Quantification of LC3-II/I protein in combined and sex-separated groups. C Quantification of p62 protein in combined and sex-separated groups. All values were corrected to GAPDH and are reported as means ± SEM, in A.U. The main effects of a 3-way ANOVA are represented on the graph at p < 0.05. The main effects of 2-way ANOVA are represented on a graph at p < 0.05. #p < 0.05, main effect age. δ p < 0.05, post hoc significance. *p < 0.05, t-test between indicated groups. N = 5/male group, 4/female group