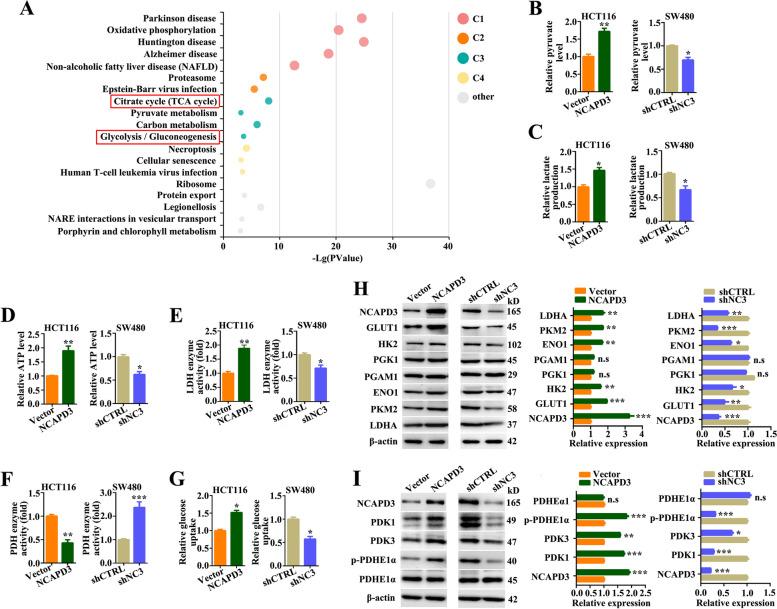
Fig. 2.
NCAPD3 enhanced glucose metabolism reprogramming in CRC cells. A All putative NCAPD3 interactors were functionally annotated by KOBAS online platform. Each bubble represents an enriched function, and the size of the bubble from small to large, representing different significance levels. C1, C2, C3, C4 represent different clusters. B-G Pyruvate level, lactate level, ATP production, lactate dehydrogenase enzyme activity, pyruvate dehydrogenase enzyme activity and glucose uptake were measurement by using related test kits in NCAPD3 overexpressed HCT116 cell line and knocked down SW480 cell line. H, I The protein expression of NCAPD3, GLUT1, HK2, PGK1, PGAM1, ENO1, PKM2, LDHA, PDK1, PDK3, PDHE1α and p-PDHE1α was detected by western blot in HCT116 cells with NCAPD3 overexpressed or SW480 cells with NCAPD3 knockdown. Quantitation of proteins were presented from three independent replicates. shCTRL represents shcontrol, shNC3 represents shNCAPD3. Each experiment was performed at least triplicate and results were presented as mean ± s.d., Student’s t-test was used to analyze the data (*P < 0.05, **P < 0.01, ***P < 0.001)

