Fig. 3.
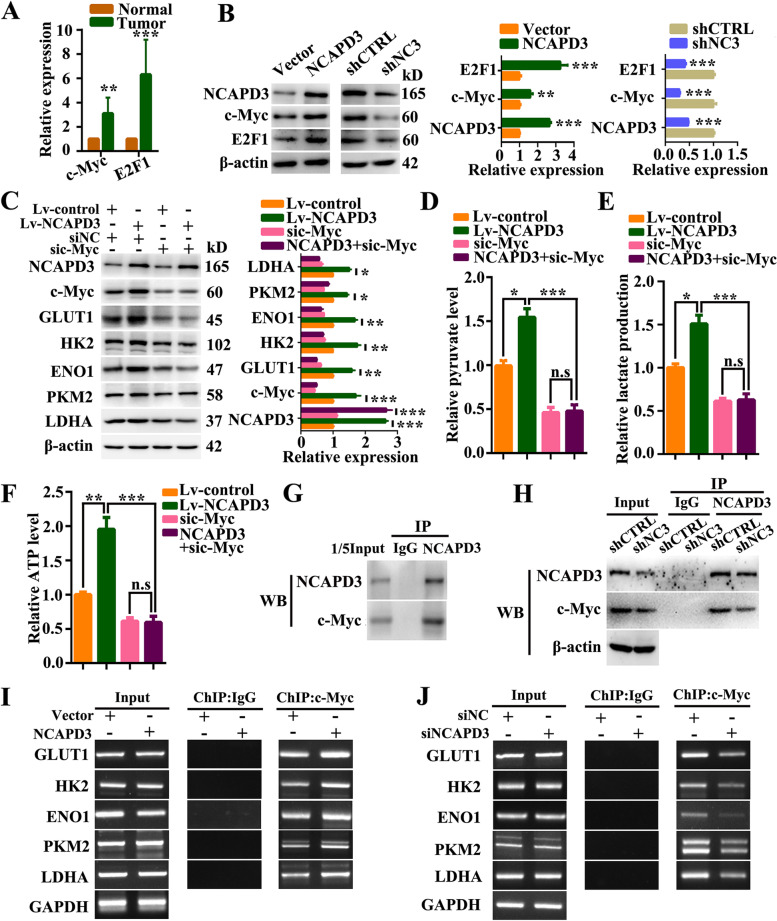
NCAPD3 upregulated c-Myc and promoted the expression of its downstream metabolic genes. A Relative expressions of c-Myc and E2F1 in CRC tissues and corresponding non-tumor normal tissues by analyzing our RNA-seq data of clinic specimen. B The protein expression of NCAPD3, c-Myc and E2F1 was detected by western blot in HCT116 cells with NCAPD3 overexpressed or SW480 cells with NCAPD3 knockdown. C Western blots of indicated proteins in HCT116 cells treated with indicated transfections. Quantitation of proteins were presented from three independent replicates. D-F Pyruvate level, lactate level, ATP production were measured with test kits in HCT116 cells treated with different treatments as indicated. G, H Co-immunoprecipitation (Co-IP) identified the interaction between NCAPD3 and c-Myc. I, J ChIP-PCR analysis of c-Myc binding at the promoter of GLUT1, HK2, ENO1, PKM2 and LDHA gene loci in NCAPD3-overexpressed HCT116 cells or NCAPD3-knockdown SW480 cells, as indicated. shCTRL represents shcontrol, shNC3 represents shNCAPD3. Each experiment was performed at least triplicate and results were shown as mean ± s.d., *P < 0.05, **P < 0.01, ***P < 0.001, based on Student’s t-test or two-way ANOVA

