Fig. 5.
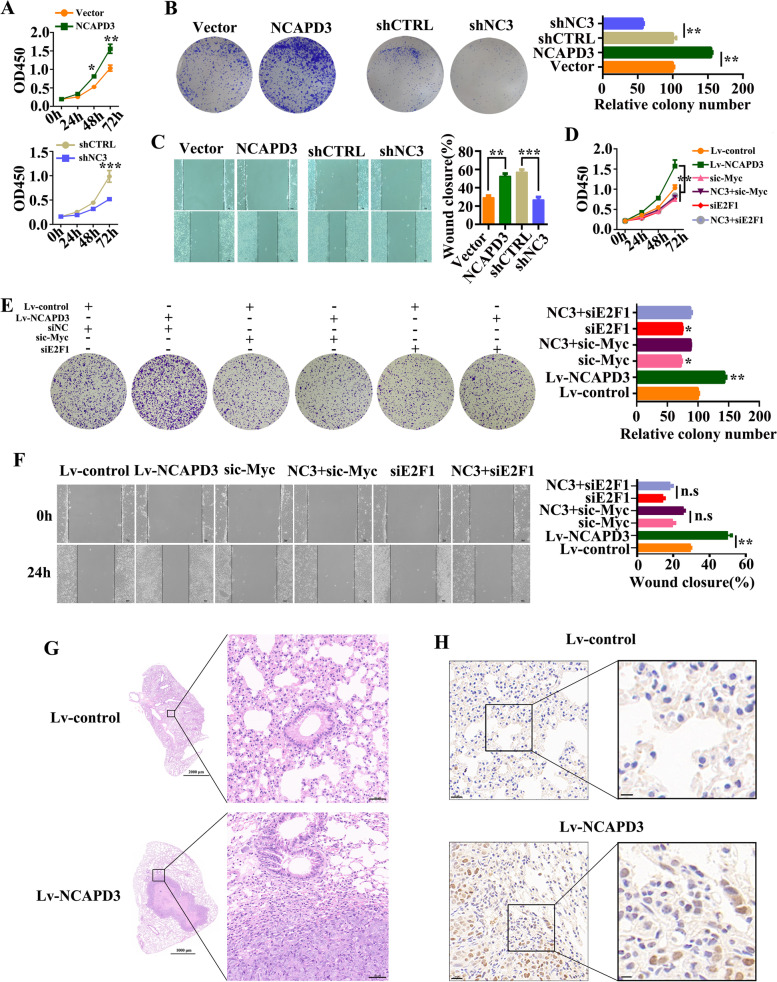
NCAPD3 promoted CRC cell proliferation, migration and tumor metastasis. A-C Cell viability, colony formation and migration were measured by CCK8 assay, colony formation assay and wound-healing assay after NCAPD3 overexpression or knockdown. Scale bar: 50 μm. D-F CCK-8 assay, colony formation analysis and wound-healing assay were performed under different transfections as indicated in figures. Scale bar: 50 μm. G Representative images of HE staining of lung tissues in NCAPD3-overexpressed and control group, n = 5. Scale bar: 50 μm. H Representative Ki67 IHC staining of lung tissues from mice, n = 5. Scale bar: 20 μm. NC3 represents NCAPD3, shCTRL represents shcontrol, shNC3 represents shNCAPD3, siNC represents negative control siRNA. All experiments were implemented three times. Student’s t-test was used to analyze the data (*P < 0.05, **P < 0.01, ***P < 0.001)

