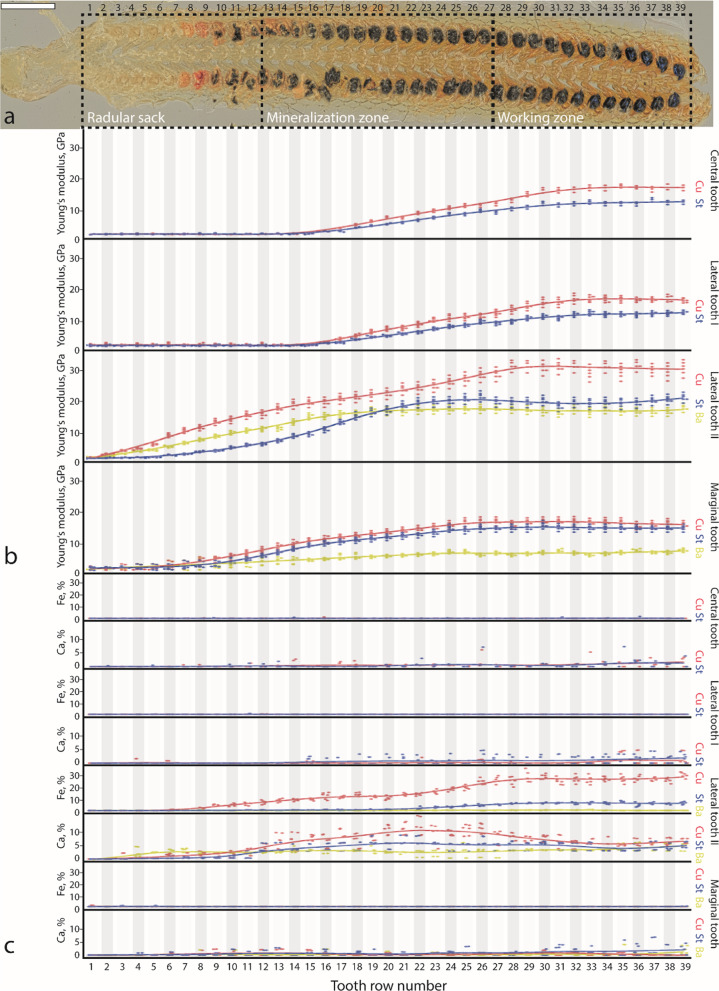
Fig. 2.
EDX and nanoindentation data obtained from native radulae (n = 3). a Light microscopy image of one radula, tooth rows are numbered, and the zones (radular sac, mineralization zone, working zone) are defined. b Changes in Young’s modulus, GPa, during ontogeny for each tooth type and tooth part (Ba, basis; Cu, cusp; St, stylus). c Changes in Fe and Ca proportions (atomic %) during ontogeny for each tooth type and tooth part. Dots represent values measured and solid lines trend lines based on the individual measurements. Scale bar: a = 250 μm

