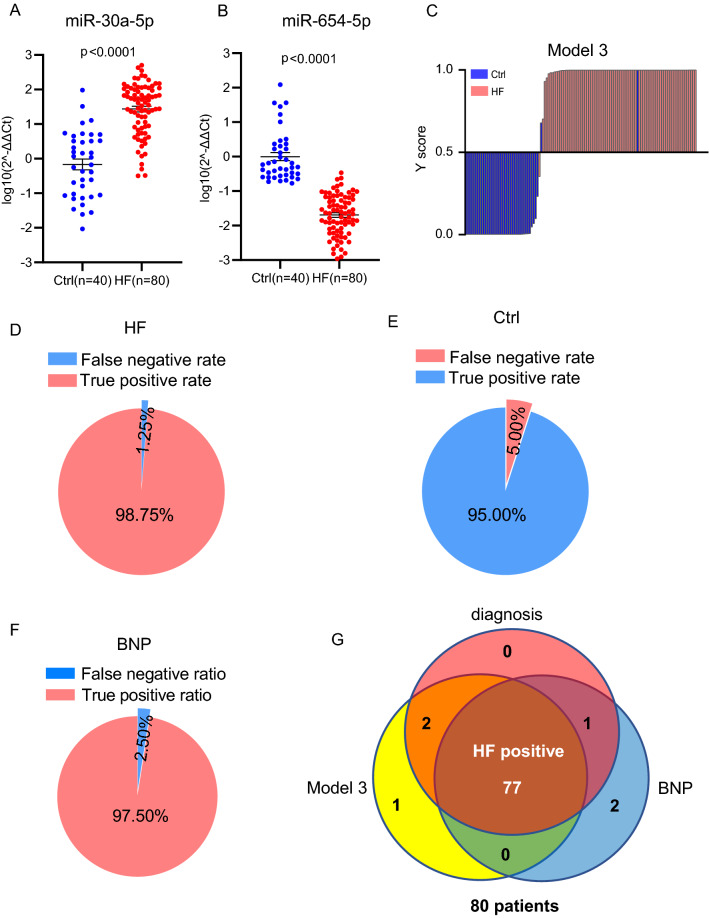
Fig. 5.
Further validation of the miRNA diagnostic model by combining the two independent clinical cohorts. A, B Expression levels of circulating miR-30a-5p (A) and miR-654-5p (B) in the 80 HF patients and 40 controls (Ctrl) combining the training and validation cohorts. C Y scores distribution plot of model 3 in the all subjects combining the training and validation cohorts. Y scores greater than 0.5 were judged as HF, otherwise as normal. D Pie graph showing the true-positive rate (98.75%) and false negative rate (1.25%) of model 3 in diagnosis of the 80 HF patients. E Pie graph showing the true-negative rate (95.00%) and false positive rate (5.00%) of model 3 tested in the 40 normal controls (Ctrl). F Pie graph showing the true-positive rate (97.50%) and false negative rate (2.50%) of the 80 HF patients by NT-proBNP-based diagnosis. G Venn graph showing overlaps between the clinically diagnosed 80 HF patients, the miRNA model-based model diagnosis and the NT-proBNP-based diagnosis

