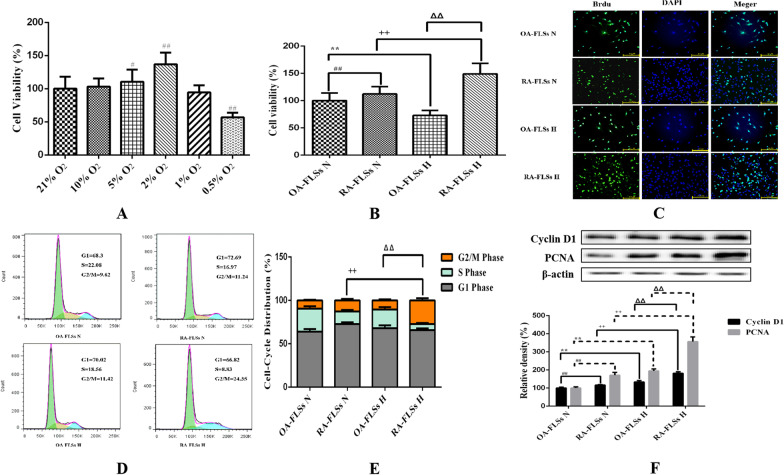
Fig. 1.
Effects of hypoxia on the proliferation of OA-FLSs or RA-FLSs. A The effects of different oxygen concentrations on the viability of RA-FLSs were detected by CCK-8 method (mean ± SD, n = 6 from three independent experiments); B The effects of hypoxia on the viability of OA-FLSs or RA-FLSs were detected by CCK-8 method (mean ± SD, n = 6 from three independent experiments); C BrdU was incorporated into OA-FLSs or RA-FLSs, cells were exposed to 21% and 2% O2 for 24 h, and then BrdU (green) and DAPI (blue) immunostaining were detected; D Flowcytometry analysized the cell proliferation with PI staining after cells were treated with different oxygen concentrations for 24 h; E Histogram depicts quantitative data from the flowcytometry analysis (mean ± SD, n = 5 from three independent experiments); F After exposure to different oxygen concentrations for 24 h, the expression of cyclin D1 and PCNA was analyzed by Western blot (mean ± SD; n = 6 from six independent experiments). #P < 0.05, ##P < 0.01 represents the comparison between OA-FLSs N and RA-FLSs N; *P < 0.05, **P < 0.01 represents the comparison between OA-FLSs N and OA-FLSs H, +P < 0.05, ++P < 0.01 represents the comparison between RA-FLSs N and RA-FLSs H, ΔP < 0.05, ΔΔP < 0.01 represents the comparison between OA-FLSs H and RA-FLSs H

