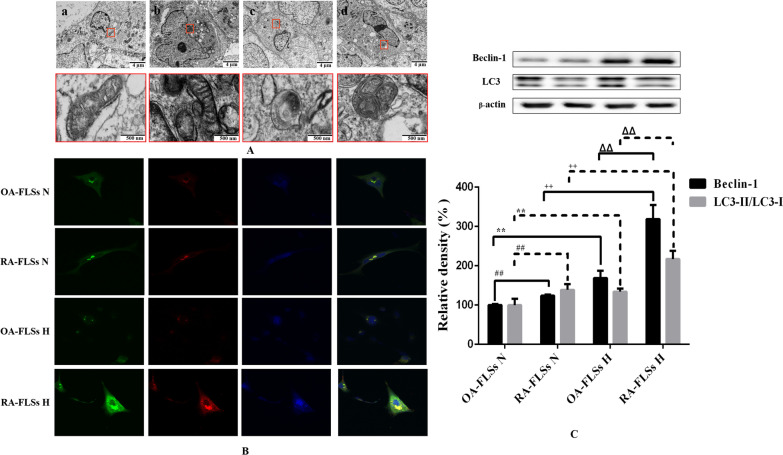
Fig. 3.
Effects of hypoxia on the mitophagy of OA-FLSs or RA-FLSs. A After exposed to 21%, 2% O2 for 24 h, cells were analysed by electron microscopy. B Cells were infected with EGFP-LC3 (Green) for 24 h and then exposed to 21%, 2% O2 for another 24 h, after that, mitochondria were marked with Mitotracker (Red), Nuclei were stained with DAPI (blue). Representative images were shown. C The expression of Beclin-1 and LC3 was analyzed by Western blot (mean ± SD, n = 6 from three independent experiments). #P < 0.05, ##P < 0.01 represents the comparison between OA-FLSs N and RA-FLSs N; *P < 0.05, **P < 0.01 represents the comparison between OA-FLSs N and OA-FLSs H, +P < 0.05, ++P < 0.01 represents the comparison between RA-FLSs N and RA-FLSs H, ΔP < 0.05, ΔΔP < 0.01 represents the comparison between OA-FLSs H and RA-FLSs H

