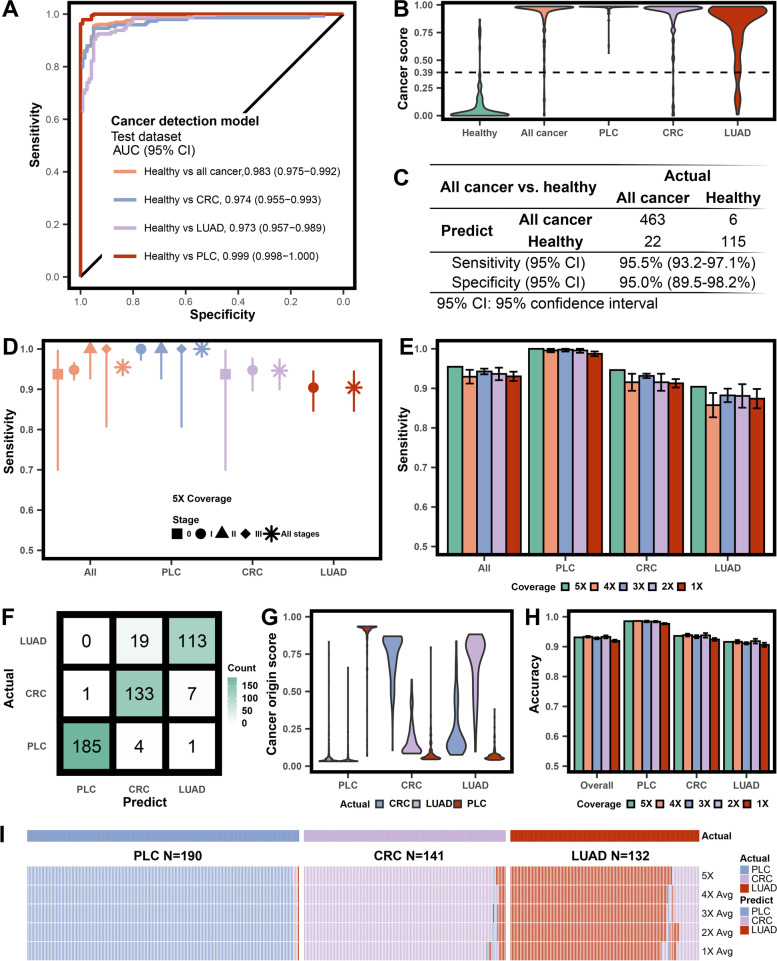
Fig. 2.
Performance and robustness valuation for the ensemble stacked model. A ROC curves evaluating the cancer detection model in distinguishing cancer patients from healthy volunteers in the test cohort, and further categorized into each cancer type class. B Violin plots illustrating cancer score distribution in the healthy, all cancer, primary liver cancer (PLC), colorectal cancer (CRC), and lung adenocarcinoma (LUAD) groups in the test cohort predicted by the cancer detection model. The 95% specificity cutoff for cancer score was 0.39, as shown by the dotted line. C Performance of the cancer detection model in identifying all cancer patients. D Dot plot of sensitivity in cancer detection by each cancer type and/or stage, at 95% specificity. The error bars represented the 95% confidence interval. E Robustness test for the cancer detection model using test cohort with downsampled coverage depth (4×-1×). The error bars were calculated based on five repeats for each coverage. F Confusion matrix of the selected test cohort by cancer detection model for the cancer origin model. G Violin illustrating cancer origin score distribution in the PLC, CRC, and LUAD groups in the selected test cohorts predicted by the cancer origin model. H Dot plot illustrating robustness test for the cancer origin model using the selected test cohort with downsampled coverage depth (4×-1×). I Heatmap illustrating the detailed results of each patient for the robustness test of the cancer origin model

