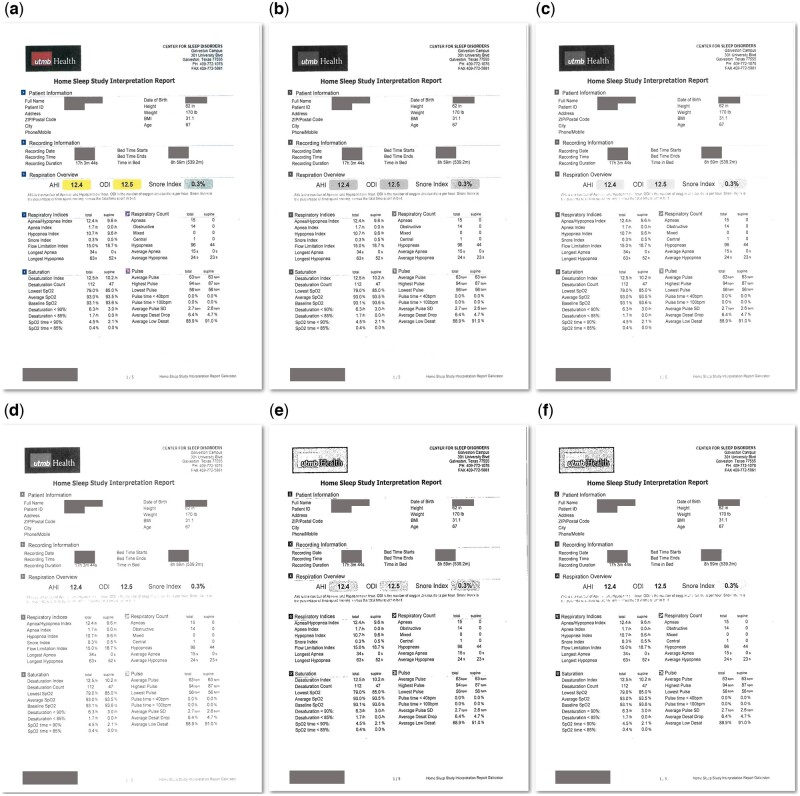
Figure 1.
Scanned document images after image preprocessing. (A) The original scanned image. (B) The gray-scaled image. (C) The image with 20% increased contrast. (D) The image with 60% increased contrast. (E) The image with dilation and erosion and 20% increased contrast. (F) the image with dilation and erosion and 60% increased contrast.

