Figure 3.
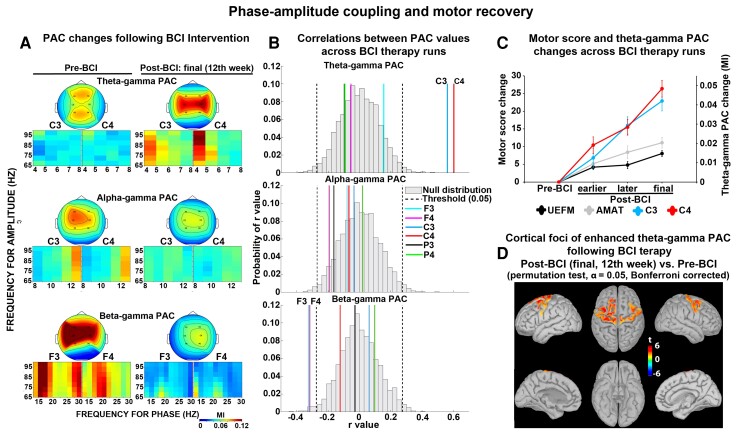
PAC and motor recovery. (A) PAC changes following BCI intervention. Coupling between the phase of theta, alpha or beta oscillations and the amplitude of gamma oscillations. (Top panels) Topographic distribution of PACs. (Bottom panels) PACs at the electrode level. Y-axis, frequency for amplitude (gamma range); X-axis, frequency for phase (theta, alpha or beta range); MI, modulation index. (B) Spearman rank correlations were run to calculate correlations between PAC values across BCI therapy runs (N = 68). Significance thresholds were set at P ≤ 0.05. Null distributions of Spearman rank correlation coefficients across all electrodes. Y-axis, probability of r-values; X-axis, r-value. (C) Longitudinal changes in motor assessment scores (UEFM and AMAT) and theta–gamma PAC values (C3 and C4 electrodes) from baseline through 12 weeks of BCI intervention. Data were shown as mean ± SEM. MI, modulation index; Y-axis, motor score change (left) and theta–gamma PAC change (right); X-axis, stages of BCI therapy runs (Pre-BCI, before initiating therapy; earlier Post-BCI, 4th week; later Post-BCI, 8th week; final Post-BCI, 12th week). UEFM, upper extremity Fugl-Meyer; AMAT: Arm Motor Ability Test. (D) Localizing electrodes to the cortical surface for theta–gamma PAC which correlated significantly with motor recovery. Source estimation was represented as t-values, based on a voxelwise non-parametric permutation tests on PAC source space. Only voxels whose t-statistic exceeded a critical threshold of P ≤ 0.05 (two-tailed, Bonferroni corrected) were retained. For the voxels not showing significant effects, t-values were set to zero.

