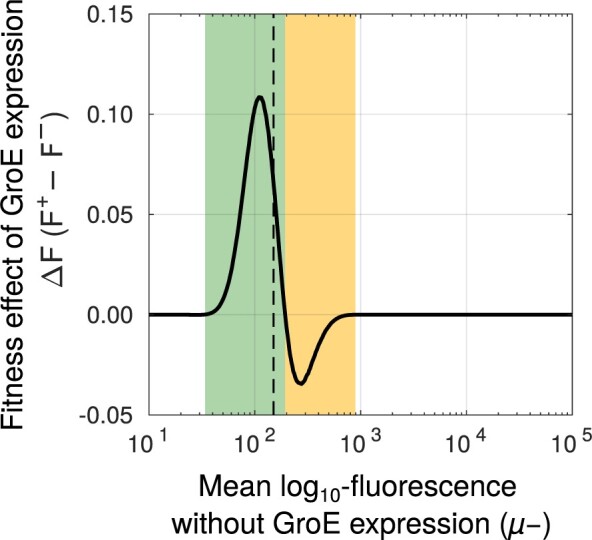
Fig. 6.

GroE increases the fitness of some mutants while reducing the fitness of the others. Change in fitness (ΔF, vertical axis) due to GroE expression predicted by our statistical model (see Materials and Methods), as a function of mean transformed fluorescence (, horizontal axis) in the absence of GroE expression. The black-dashed vertical line denotes the selection threshold (150 arbitrary units of fluorescence). A positive value of ΔF indicates increased fitness (green area) whereas a negative value indicates reduced fitness (orange area), in response to GroE expression.
