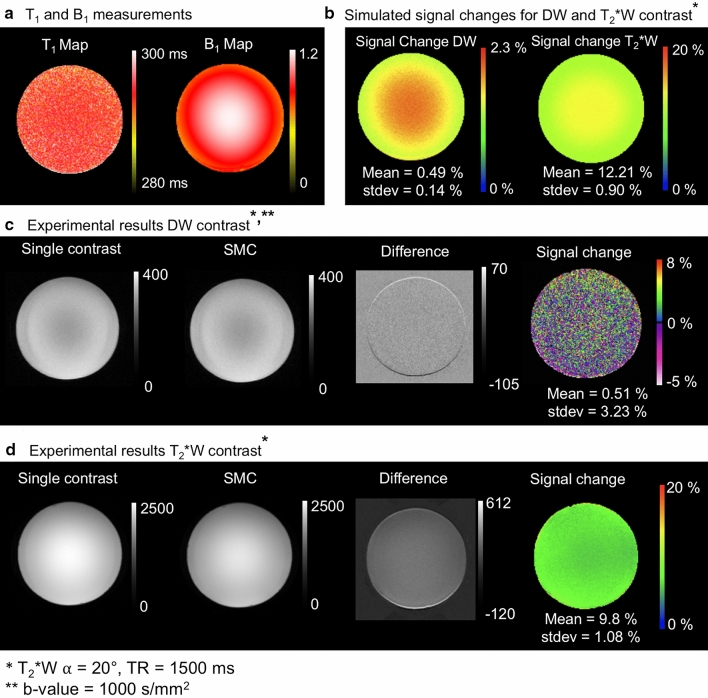
Fig. 3.
a Measured T1 and B1 maps in the spherical water-based phantom, b Simulated magnetization signal changes [%] with Bloch equations on the basis of the T1 and B1 map, c DW acquisition without and with simultaneous acquisition of T2*W contrast, the corresponding difference image and signal-change map, d T2*W contrast without and with simultaneous acquisition of the DW contrast, the corresponding difference image and signal-change map. The difference images show evidence of an uncorrected frequency drift during measurement in the outer ring. These areas of high differences are masked out in the saturation maps. Positive values [%] of signal change means smaller grey values in the SMC images than in the single-contrast images and vice versa

