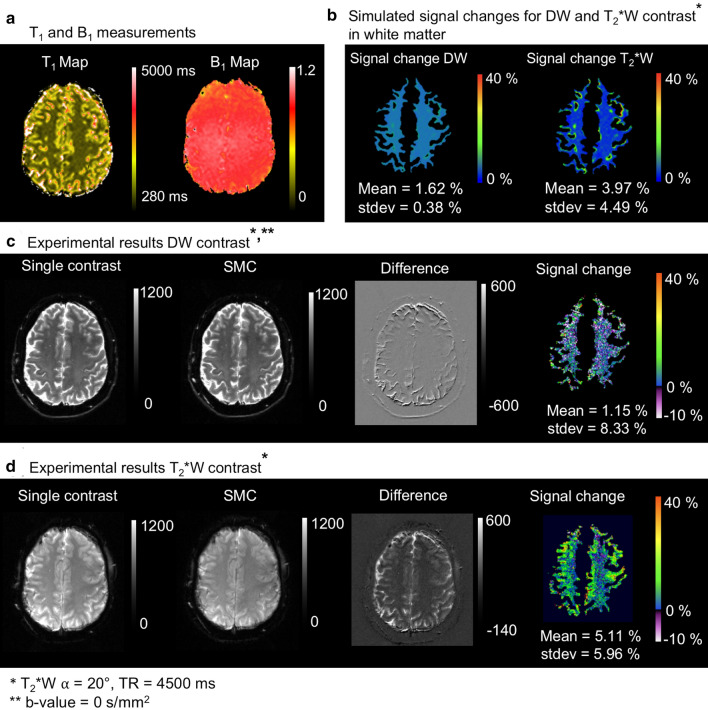
Fig. 5.
Signal change results for slice iteration scheme B: a Measured T1 and B1 maps in vivo, b Simulated magnetization signal change [%] with Bloch equations on the basis of the T1 and B1 map in white matter, c DW acquisition without and with simultaneous acquisition of T2*W contrast, the corresponding difference image and signal change map, d T2*W contrast without and with simultaneous acquisition of the DW contrast, the corresponding difference image and signal change map. Positive values [%] of signal change means smaller grey values in the SMC images than in the single-contrast images and vice versa

