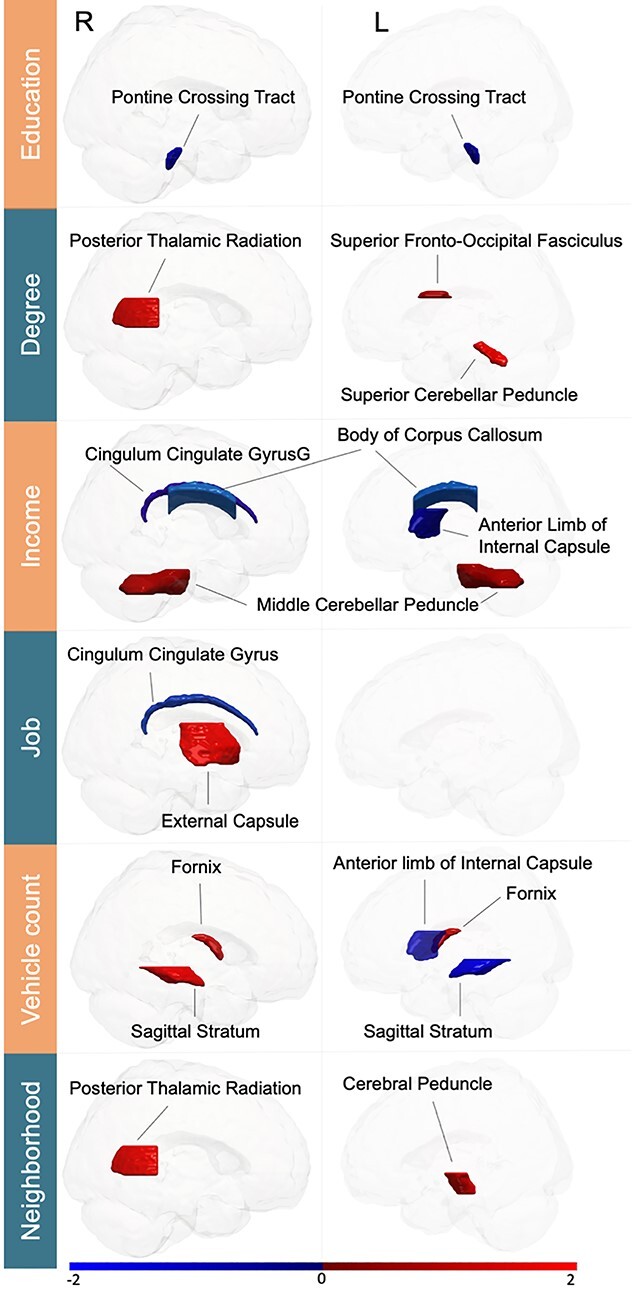
Fig. 3.

Population variability in SES reverberates in white matter tract microstructure. Supervised learning algorithms revealed associations in positive (red) and negative (blue) direction specific to SES indicators across 48 white matter tracts. The identified links to SES involved association, commissural, and projection fibers (all statistically significant at P < 0.001, after explicitly considering multiple comparisons). Three fiber tracts (right cingulum and posterior thalamic radiation, left internal capsule) were robustly associated with multiple SES dimensions. Analogous to our gray matter findings (Fig. 2), these brain substrates of SES in white matter corroborate a complementary composition of single SES dimensions. The color bar represents z-scores. R/L = right/left hemisphere. For full effect sizes and bootstrap uncertainty intervals used to assess significance, see Supplementary Tables 5–7.
