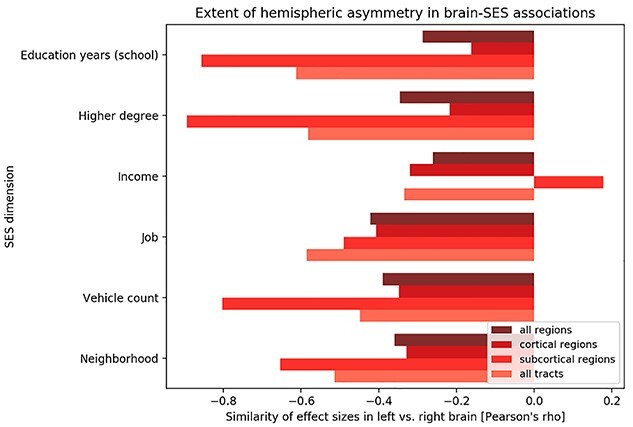
Fig. 4.

The left and right brain hemisphere relate to SES factors in opposite ways. All main analyses in our study were based on multivariate multi-output algorithms of six major determinants of SES on brain atlas features. Separate pattern-learning analyses were conducted to explain the SES dimensions based on either a) gray matter volumes of 111 cortical and subcortical regions (Harvard-Oxford atlas; Fig. 2) or b) microstructure of 48 white matter tracts (Johns Hopkins University atlas; Fig. 3). After model building, the formed estimates for the model parameters were summarized for interrogation of systematic interhemispheric effects. To this end, we computed Pearson’s correlation coefficients across the (bootstrap-uncertainty-adjusted) model parameters of brain features that are homologous in the left vs. right brain (x-axis). This post-hoc aggregation across the computed models uncovered notable anti-correlation in the associations of how left-sided and right-sided brain features are linked to interindividual variation in SES. Our observation of hemispherically differentiated brain-SES correspondence held up when considering a) all regions (darkest red tone), b) only cortical regions, c) only subcortical regions, and d) only fiber tracts (lightest red tone). When restricting attention to statistically significant brain-SES associations, rather than the spatial distribution of the full effect sizes, we substantiated evidence for a distributed brain asymmetry pattern of SES (Supplementary Fig. 4).
