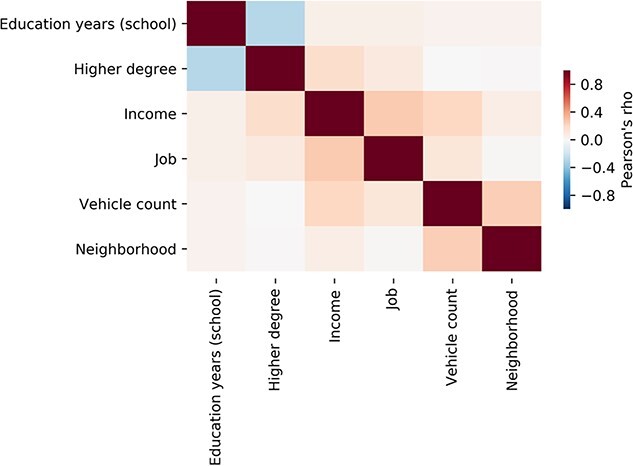
Fig. 1.

Mutual relationships between different indicators of SES. This exploratory analysis in 10.000 UK biobank participants shows that socioeconomic traits relate to a complex constellation of social, demographic, and financial aspects. Pearson’s correlation shows that these factors are moderately interrelated. The behavioral markers thus capture largely complementary aspects of an individual’s standing in society (Farah 2018). A negative relation between the indices of higher degree and education years is expected since education years only count time in school (not college or university) (see Materials and Methods section). The color tones indicate Pearson’s correlation coefficients ϱ. All index–index relations yielded a ϱ < 0.5. These descriptions thus indicate that our SES dimensions involve mostly specific, but also a degree of shared variation across participants. For mixture deconvolution of joint and distinct information in the SES indicators, see Supplementary Fig. 1.
