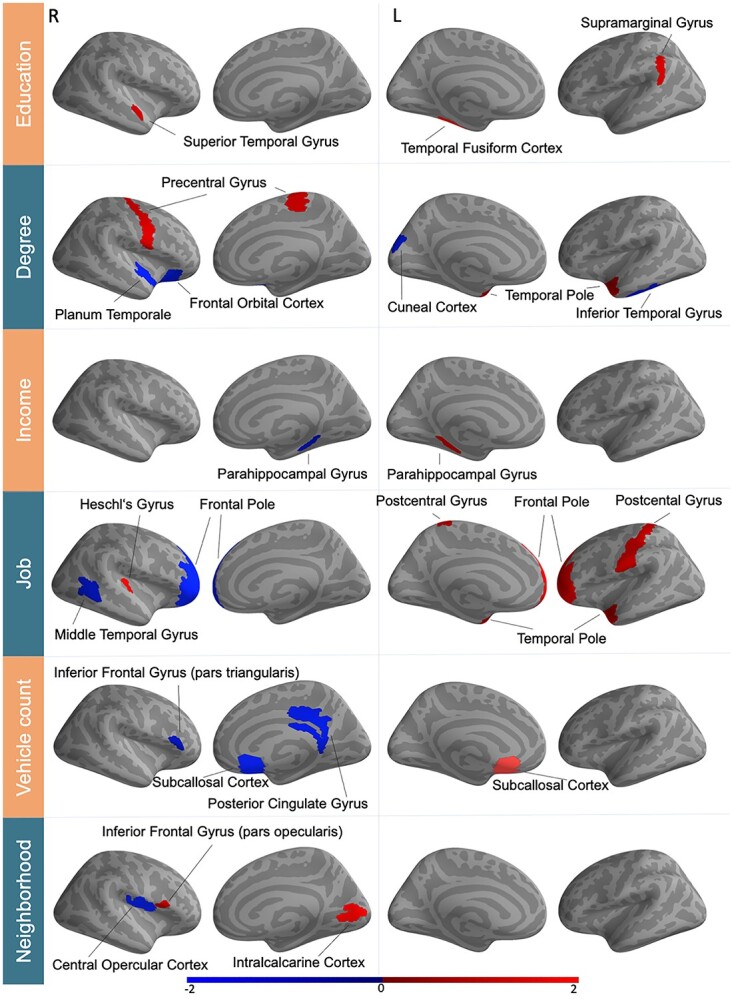
Fig. 2.

Population variability in SES shows imprints in regional gray matter morphology. Supervised learning algorithms identified a variety of multivariate patterns between 111 gray matter regions and SES indicators. These brain–behavior associations (all significant at P < 0.001, after explicitly considering multiple comparisons) uncovered both positive (red) and negative (blue) direction. Certain regions, including the left caudate and left temporal pole in particular, were associated with several SES determinants. These brain manifestations uncover similarity and idiosyncrasies between the six examined SES indicators. The color bar represents z-scores. R/L = right/left hemisphere. For full effect sizes and bootstrap uncertainty intervals used to assess significance, see Supplementary Tables 2–4.
