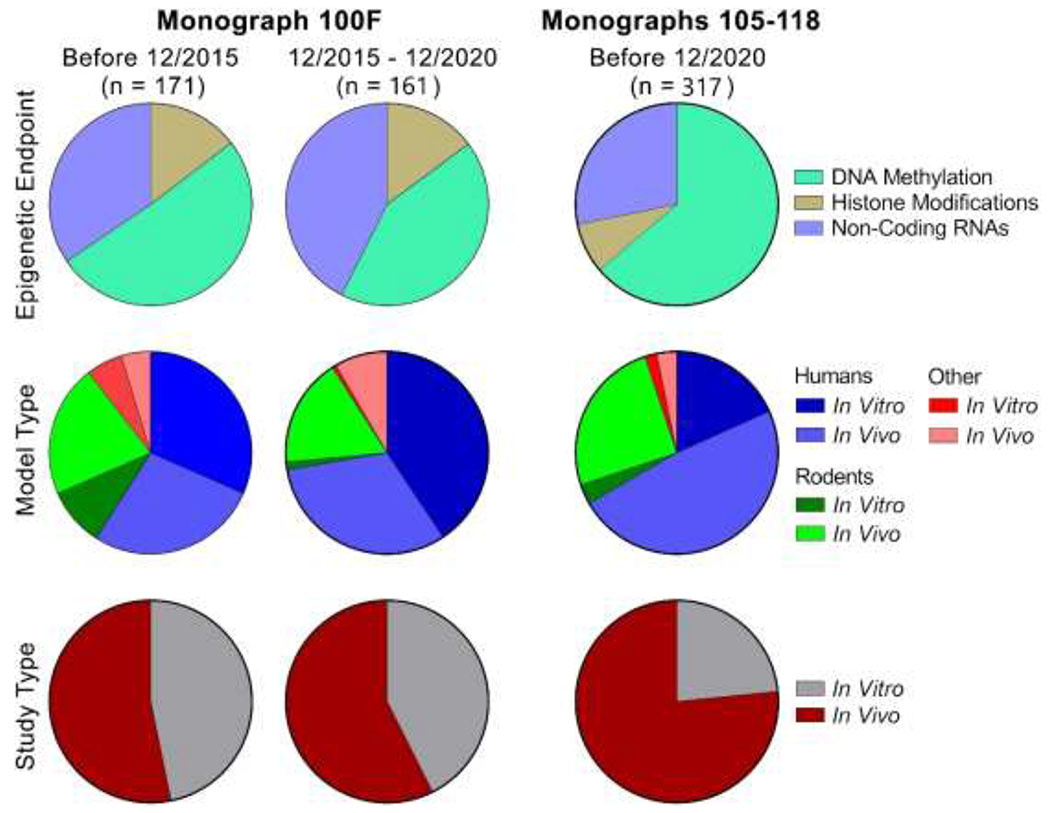
Figure 5.

A relative comparison of epigenetic endpoints, model types (human, rodent, other), and study types (in vitro or in vivo) for the chemicals, related occupations, or types of exposure included in IARC Monographs 100F (left) and 105-118 (right). The pie charts for each type of comparison are color coded as shown in the legends.
