
Fig. 1.
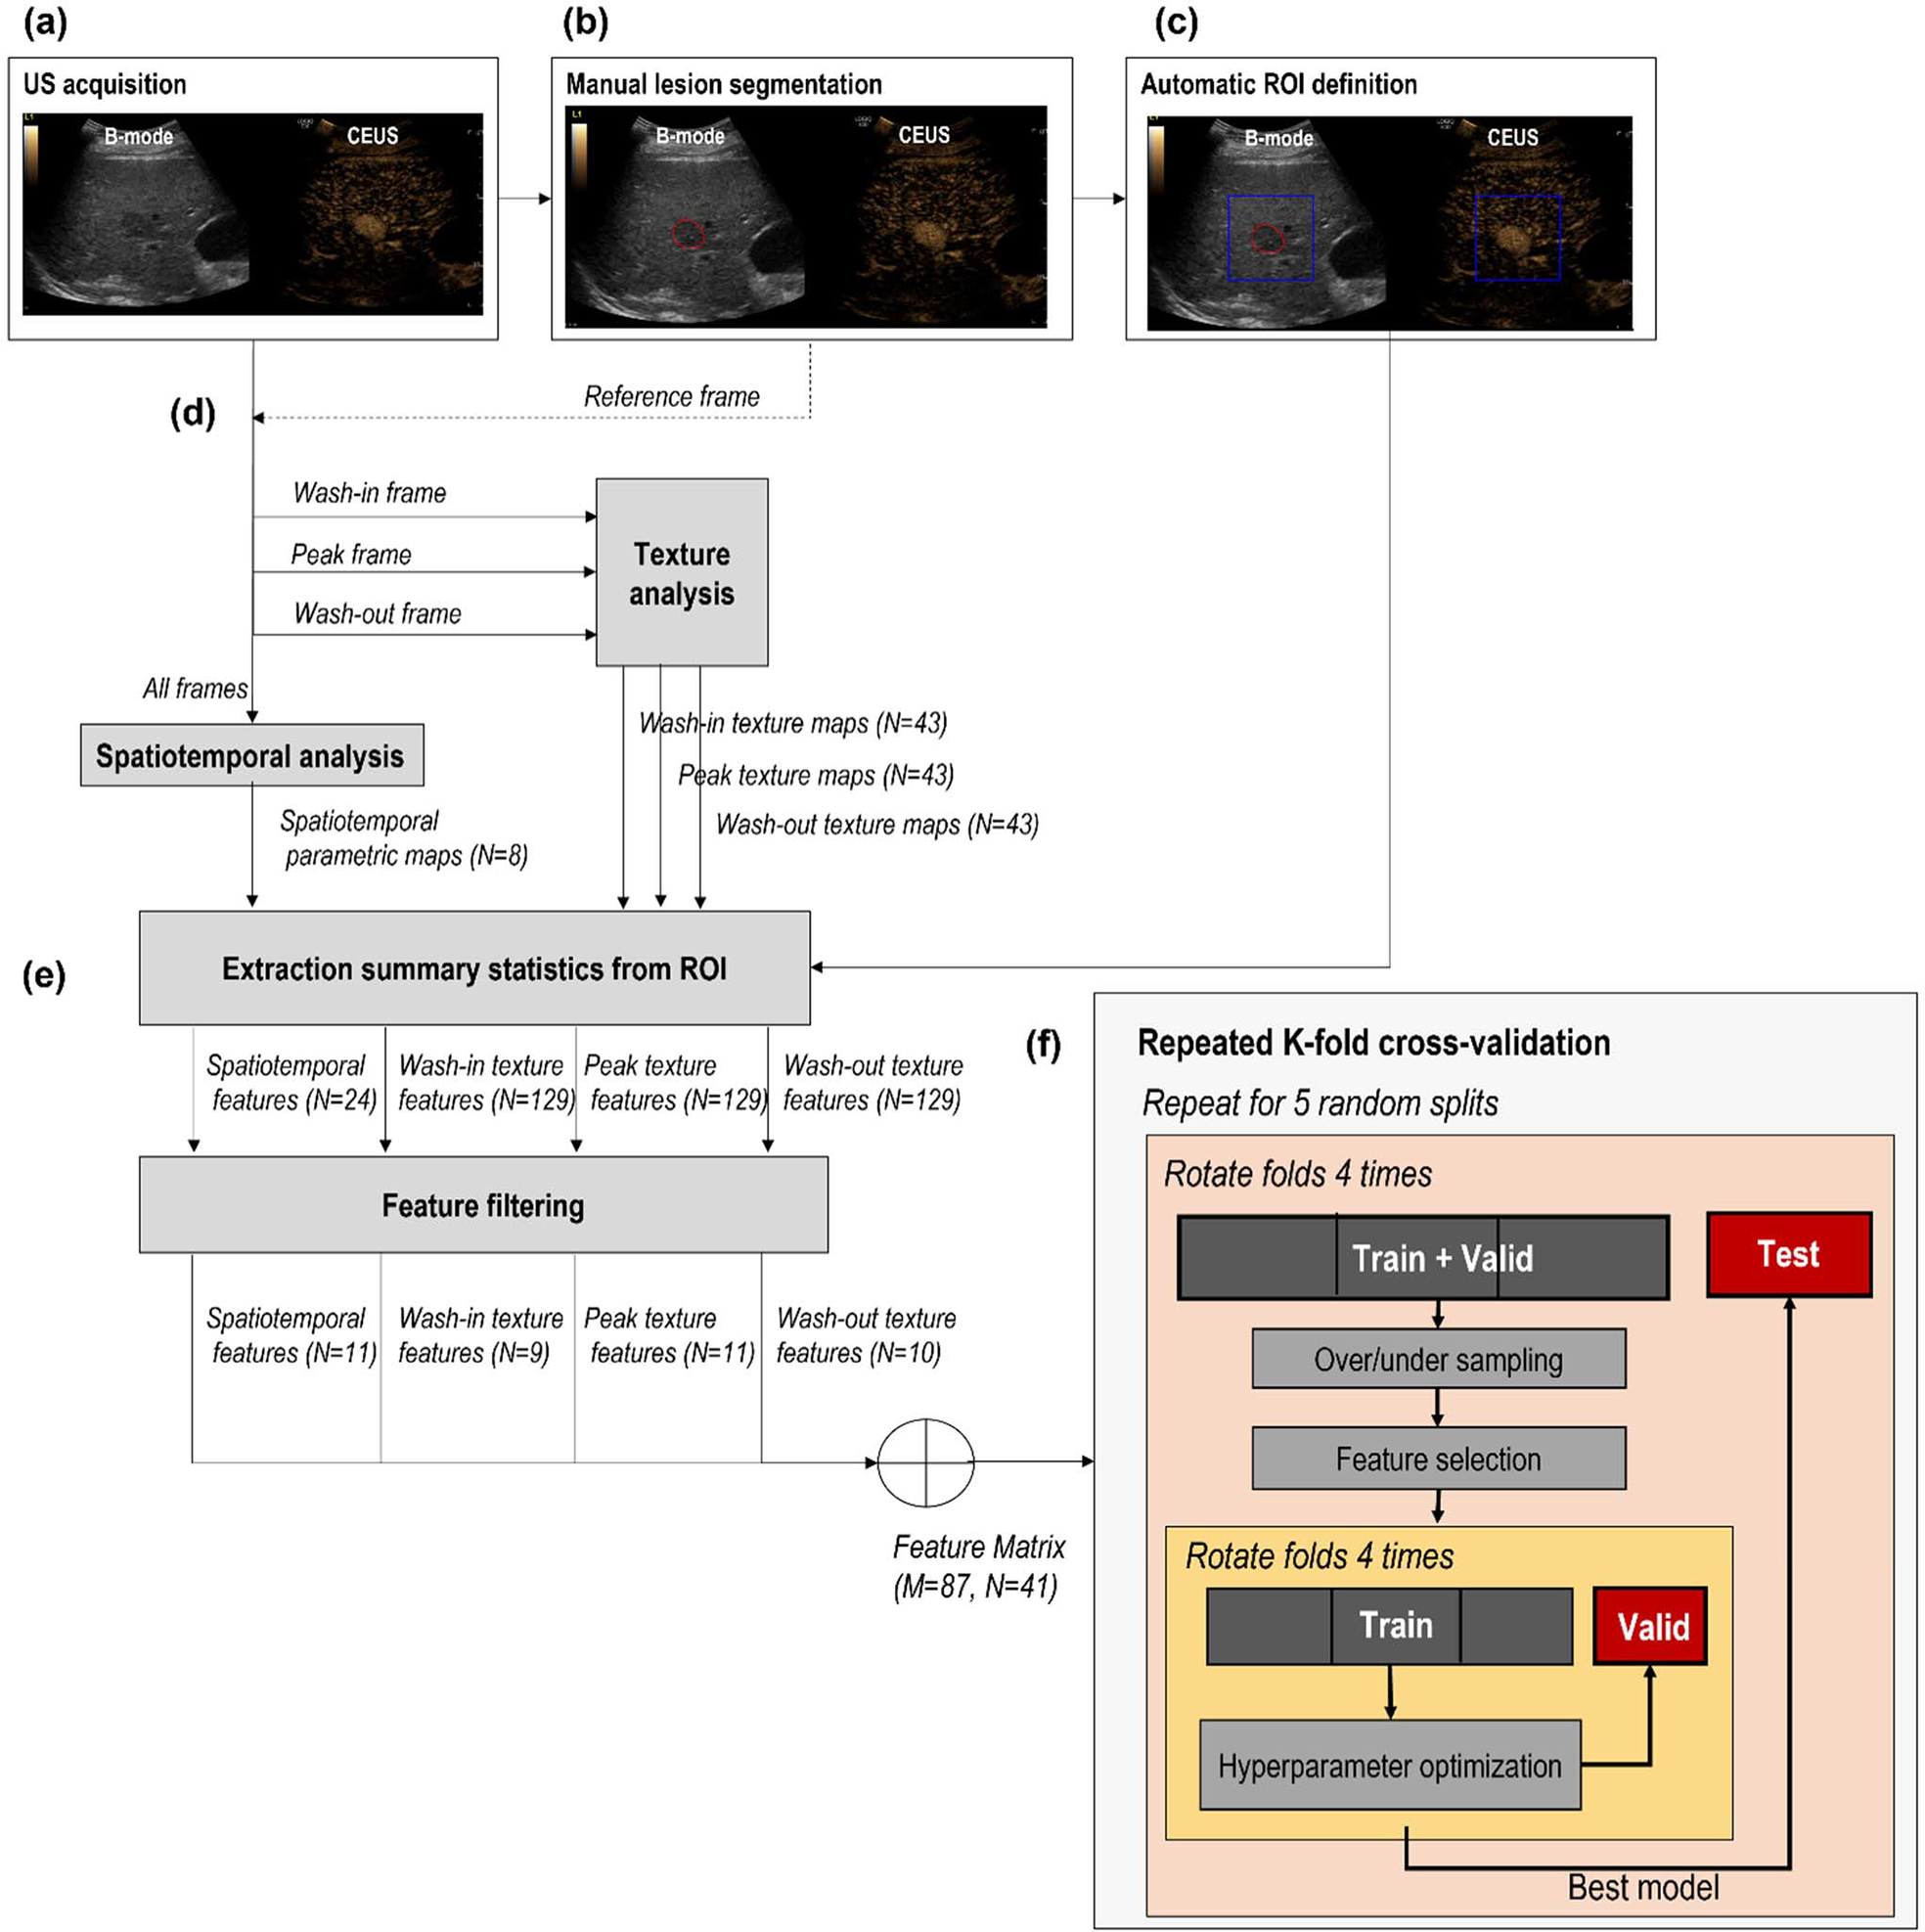
Flowchart describing the processing and machine learning pipelines. (a) Side-by-side view of B-mode and CEUS. (b) Manual segmentation of the lesion on the B-mode image. (c) Automatic definition of the ROI based on the location of the manually drawn lesion. (d) Extraction of spatiotemporal features (using all frames) and texture features at wash-in, peak, and wash-out frames. (e) Extraction of summary statistics from ROI and feature filtering for dimensionality reduction; N represents the number of selected features at each step, while M represents the number of samples. (f) Repeated nested k-fold cross-validation procedure for hyperparameter tuning (inner loop, yellow) and performance evaluation (outer loop, orange).