
Figure 2: Transcriptional profiling shows LL-37 enables U1 to trigger activation of distinct innate immune pathways.
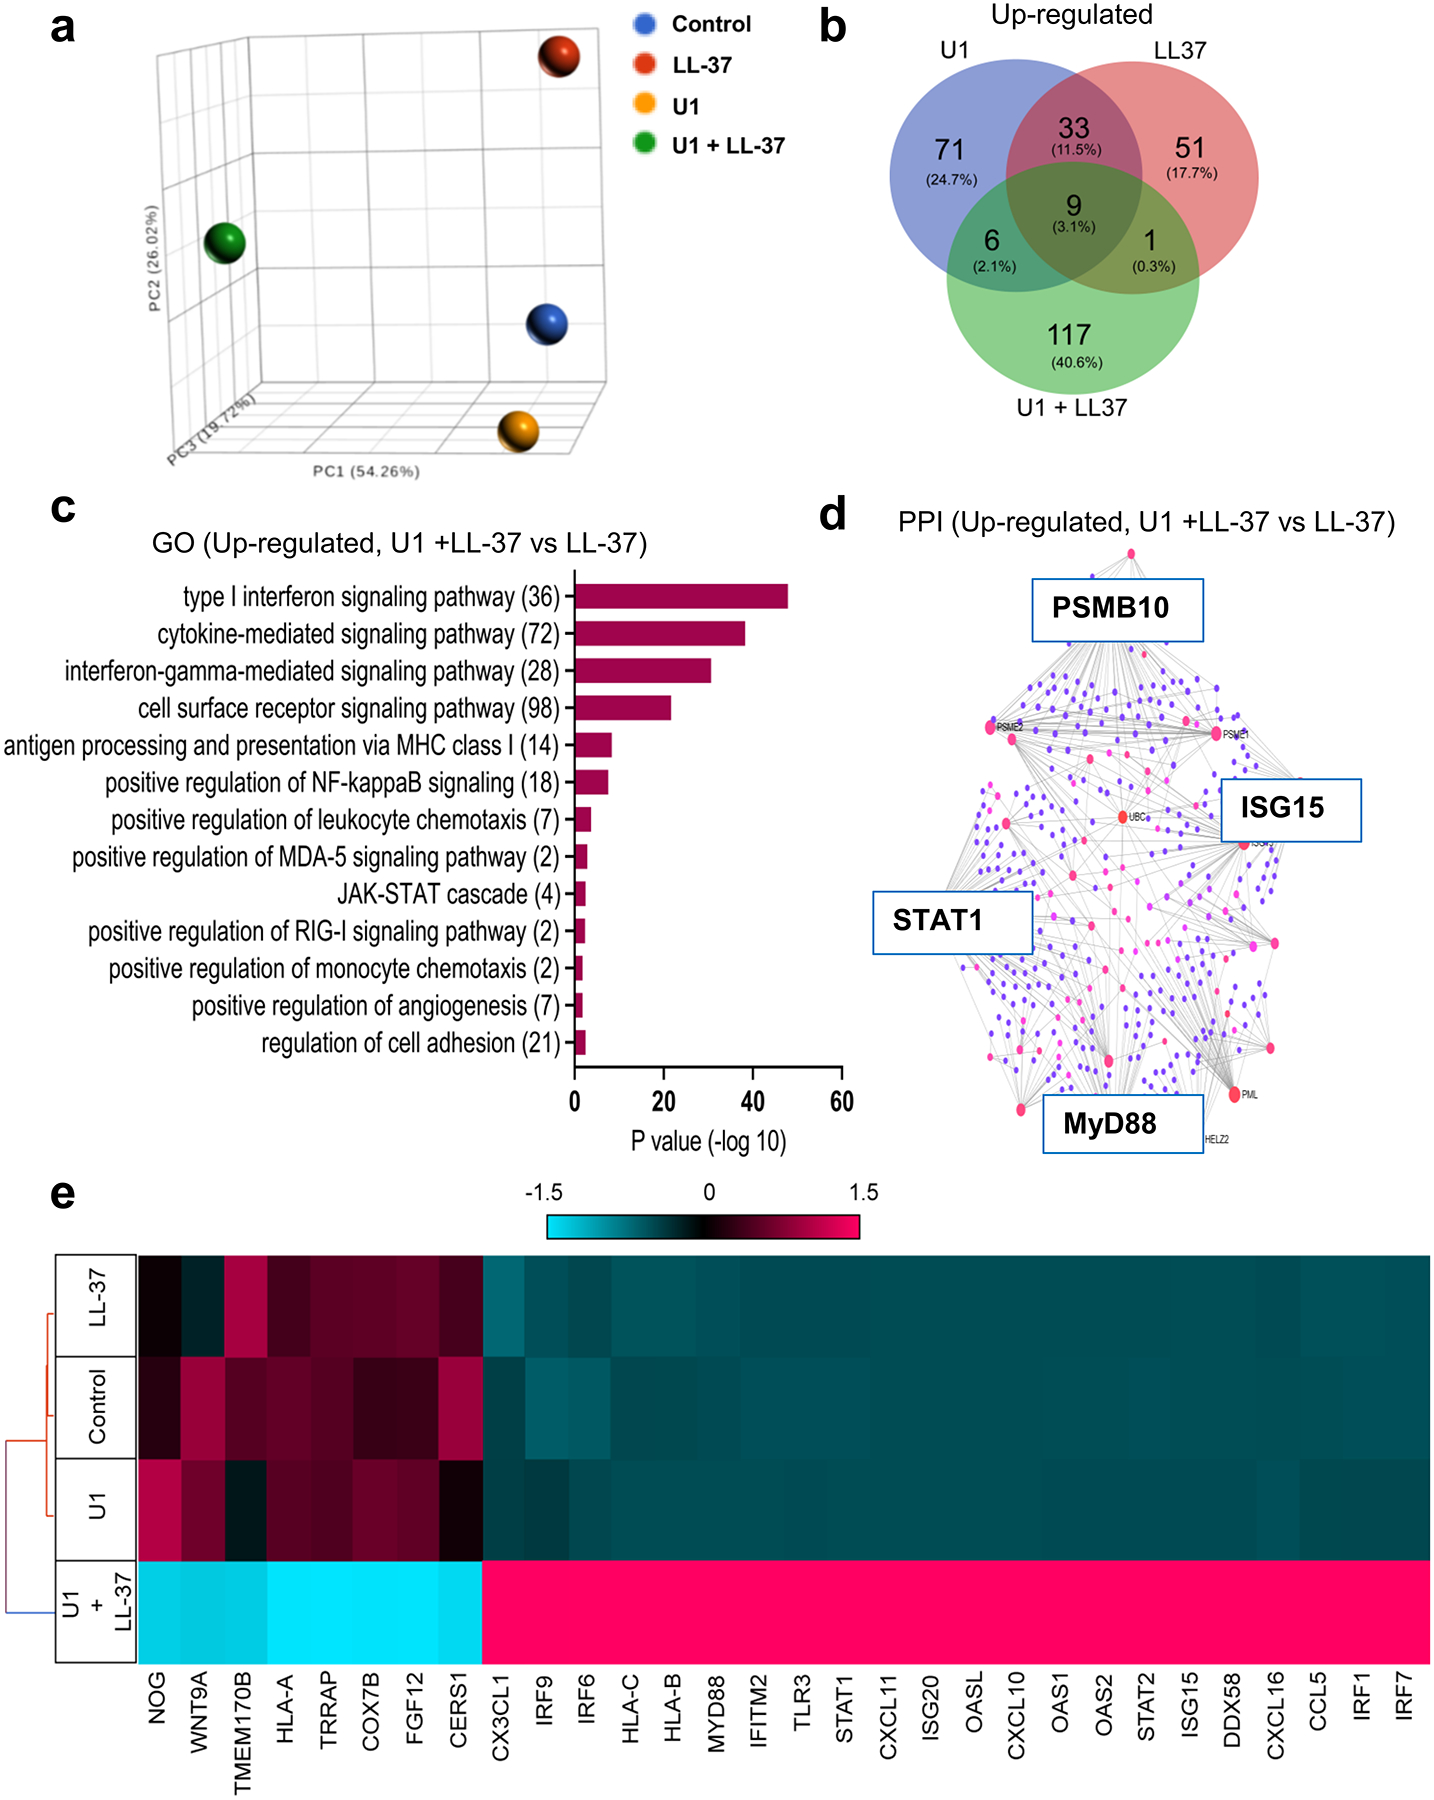
(a) A principal component analysis (PCA) plot for total transcriptional profile (b) Venn Diagram for up-regulated gene set from HDMECs treated with U1 and/or LL-37 (c) Gene ontology (GO) pathway analysis of genes up-regulated in cells co-treated with U1 and LL-37 (d) Protein-protein interaction (PPI) networks derived from network analysis for genes up-regulated in U1 andLL-37 co-treated gene set as compared to LL-37 treatment are shown. The red and blue color nodes represent their betweenness centrality values, red being the highest and blue lowest. (e) Hierarchical clustering and Heatmap visualization of selected genes from GO enriched pathways (1.5-fold change)