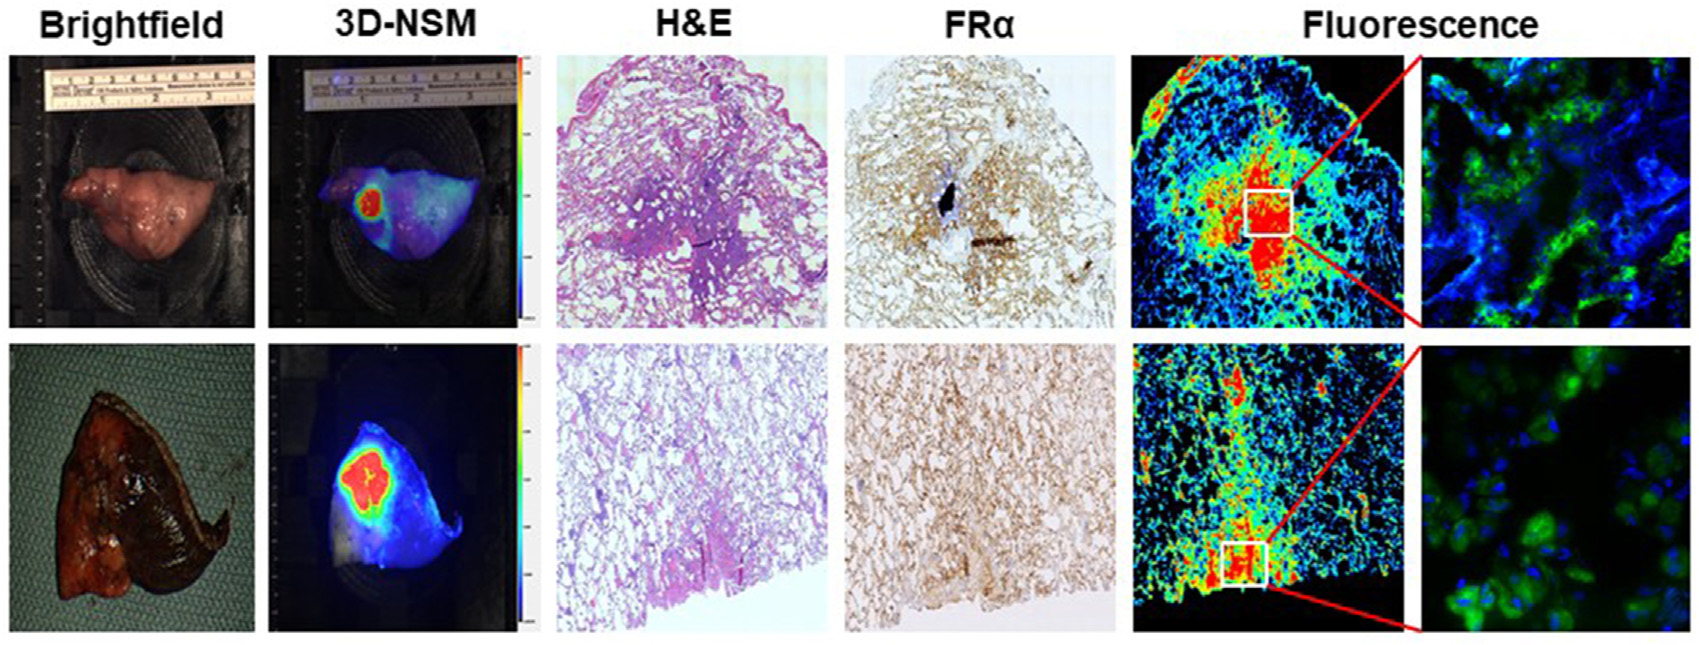
FIGURE 4.

Correlation of macroscopic fluorescence with folate receptor alpha (FRα) expression in lung lesions. This figure shows representative images of patients in the study that underwent 3-dimensional near-infrared specimen mapping (3D-NSM). The leftmost 2 columns show macroscopic brightfield and 3D-NSM images, respectively. The center column shows microscopic evaluation of the specimens after hematoxylin and eosin staining. The rightmost 3 columns show immunohistochemistry analysis for FRα expression and fluorescence microscopy, showing clear correlation between the areas of highest FRα expression and brightest fluorescence. (H&E, hematoxylin and eosin.)
